How to Scrape HTML Tables Into a Data Frame Using BeautifulSoup
Python has various packages to work with considering project requirements; one is BeautifulSoup, which is used to parse HTML and XML documents.
It creates a parse tree for the parsed pages that we can use to extract information (data) from HTML, which is beneficial for web scraping. Today’s tutorial teaches how to scrape HTML tables into a data frame using the BeautifulSoup package.
Use BeautifulSoup to Scrape HTML Tables Into a Data Frame
It is not necessary that we always get the organized and cleaned data every time.
Sometimes, we need the data which is available on the websites. For that, we must be able to collect it.
Fortunately, Python’s BeautifulSoup package has the solution for us. Let’s learn how we can use this package to scrape tables into a data frame.
First, we need to install this package on our machine to be able to import it into our Python scripts. We can use the pip command to install BeautifulSoup on Windows operating system.
pip install beautifulsoup
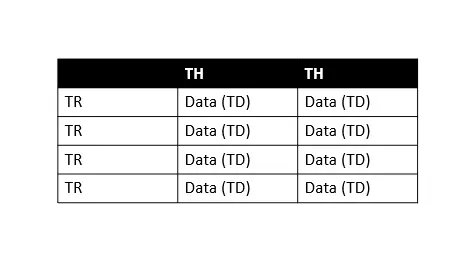
You can visit this documentation for further information. We know that we are not familiar with the basic structure of the HTML table, which is important to know while scraping; let’s understand that to follow along with this tutorial.
In the above table, TH means table header, TR means table row, and TD means table data (we call it cells). As we can see that every table row has multiple table data, so we can easily iterate over each row to extract information.
Now, let’s learn it step-by-step.
-
Import Libraries
import requests
import pandas as pd
from bs4 import BeautifulSoup
First, we need to import all of these libraries, the
pandaslibrary for working with data frames,bs4(beautiful soup) for scraping data, and therequestslibrary for making HTTP requests using Python. -
Download Content from the Web Page
web_url = "https://pt.wikipedia.org/wiki/Lista_de_bairros_de_Manaus"
data = requests.get(web_url).text
# data
# print(data)
# print(type(data))
Here, we save the required URL in the
web_urlvariable and make an HTTP request using therequestsmodule.We use the
.get()from therequestsmodule to retrieve data from the specifiedweb_urlwhile.textmeans we want to retrieve data as a string.So, if we print as
print(type(data)), we will see that we retrieved the whole page’s HTML as a string. You can play around by printingdata,print(data)andprint(type(data)).All these are in the above code fence; you can uncomment them and practice.
-
Create
BeautifulSoupObjectbeautiful_soup = BeautifulSoup(data, "html.parser") # print(type(beautiful_soup.b))The
BeautifulSoupobject (beautiful_soup) represents the whole parsed document. So, we can say it’s a complete document that we’re trying to scrape.Mostly, we treat it as
Tagobject, which can also be checked usingprint(type(beautiful_soup.b))statement. Now, we have the complete HTML of the required page.The next step is to figure out the table we want, we could get information from the very first table, but there is a possibility of multiple tables on the same web page.
So, finding the required table we want to scrape is important. How? We can easily do that by inspecting the source code.
For that,
right-clickanywhere on the required web page and selectinspect, press Ctrl+Shift+C to select the elements (highlighted in red in following screenshot), you can also use search box to find specific tags (highlighted in green in the following screenshot).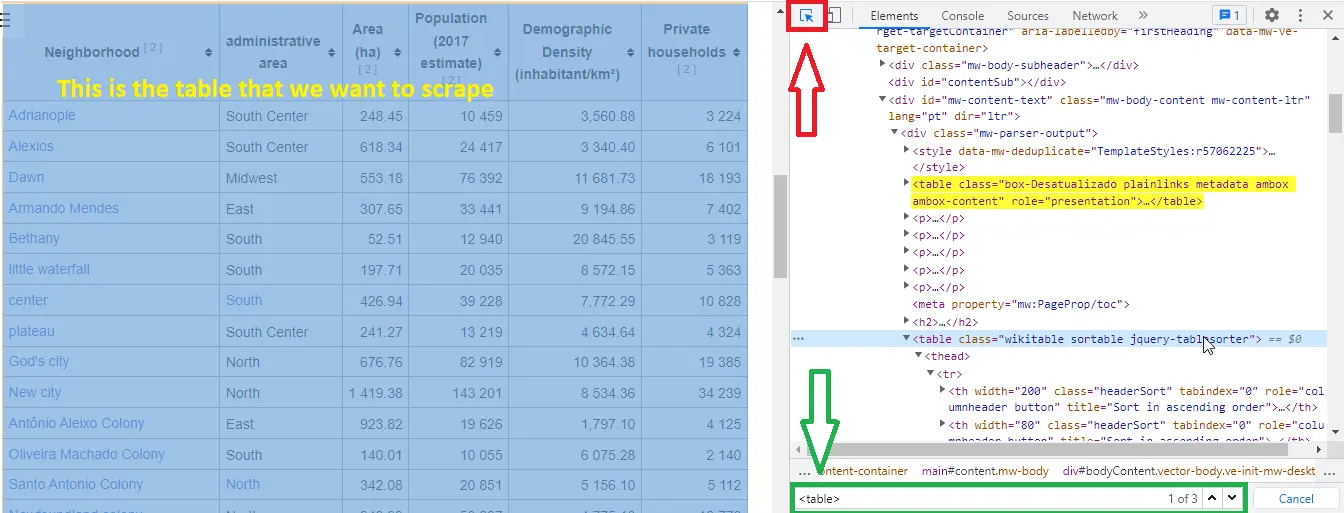
We have three tables; as shown in the above screenshot (see this number in the search box, highlighted in green), we are using the highlighted table with
class="wikitable sortable jquery-tablesorter".The point is, why are we using the
classattribute to select the table? It is because the tables don’t have any title but aclassattribute. -
Verify Tables with Their Classes
print("Classes of Every table:")
for table in beautiful_soup.find_all("table"):
    print(table.get("class"))
Output:
Classes of Every table:
['box-Desatualizado', 'plainlinks', 'metadata', 'ambox', 'ambox-content']
['wikitable', 'sortable']
['nowraplinks', 'collapsible', 'collapsed', 'navbox-inner']
Here, we iterate over all
<table>elements to find their classes via getting theclassattribute. -
Search for
wikitableandsortableClassestables = beautiful_soup.find_all("table") table = beautiful_soup.find("table", class_="wikitable sortable")First, we create a list of all tables and then look for the table with classes
wikitableandsortable. -
Create a Data Frame and Populate It
df = pd.DataFrame( columns=["Neighborhood", "Zone", "Area", "Population", "Density", "Homes_count"] ) mylist = [] for table_row in table.tbody.find_all("tr"): table_columns = table_row.find_all("td") if table_columns != []: neighbor = table_columns[0].text.strip() zone = table_columns[1].text.strip() area = table_columns[2].span.contents[0].strip("&0.") population = table_columns[3].span.contents[0].strip("&0.") density = table_columns[4].span.contents[0].strip("&0.") home_count = table_columns[5].span.contents[0].strip("&0.") mylist.append([neighbor, zone, area, population, density, home_count]) df = pd.DataFrame( mylist, columns=["Neighborhood", "Zone", "Area", "Population", "Density", "Homes_count"], )Here, we define a data frame with
Neighborhood,Zone,Area,Population,Density, andHomes_countcolumns. Then, we iterate over the HTML table to retrieve data and populate the data frame we just defined. -
Use
df.head()to Print First Five Documentsprint(df.head())Output:
Neighborhood Zone Area Population Density Homes_count 0 Adrianópolis Centro-Sul 248.45 10459 3560.88 3224 1 Aleixo Centro-Sul 618.34 24417 3340.4 6101 2 Alvorada Centro-Oeste 553.18 76392 11681.73 18193 3 Armando Mendes Leste 307.65 33441 9194.86 7402 4 Betânia Sul 52.51 1294 20845.55 3119
Complete Source Code:
import requests
import pandas as pd
from bs4 import BeautifulSoup
web_url = "https://pt.wikipedia.org/wiki/Lista_de_bairros_de_Manaus"
data = requests.get(web_url).text
beautiful_soup = BeautifulSoup(data, "html.parser")
print("Classes of Every table:")
for table in beautiful_soup.find_all("table"):
print(table.get("class"))
tables = beautiful_soup.find_all("table")
table = beautiful_soup.find("table", class_="wikitable sortable")
df = pd.DataFrame(
    columns=["Neighborhood", "Zone", "Area", "Population", "Density", "Homes_count"]
)

mylist = []
for table_row in table.tbody.find_all("tr"):
    table_columns = table_row.find_all("td")

    if table_columns != []:
        neighbor = table_columns[0].text.strip()
        zone = table_columns[1].text.strip()
        area = table_columns[2].span.contents[0].strip("&0.")
        population = table_columns[3].span.contents[0].strip("&0.")
        density = table_columns[4].span.contents[0].strip("&0.")
        home_count = table_columns[5].span.contents[0].strip("&0.")

        mylist.append([neighbor, zone, area, population, density, home_count])

df = pd.DataFrame(
    mylist,
    columns=["Neighborhood", "Zone", "Area", "Population", "Density", "Homes_count"],
)
print(df.head())
Output:
Classes of Every table:
['box-Desatualizado', 'plainlinks', 'metadata', 'ambox', 'ambox-content']
['wikitable', 'sortable']
['nowraplinks', 'collapsible', 'collapsed', 'navbox-inner']
   Neighborhood          Zone    Area Population   Density Homes_count
0    Adrianópolis    Centro-Sul 248.45      10459   3560.88        3224
1          Aleixo    Centro-Sul 618.34      24417    3340.4        6101
2        Alvorada Centro-Oeste 553.18      76392 11681.73       18193
3 Armando Mendes         Leste 307.65      33441   9194.86        7402
4         Betânia           Sul   52.51       1294 20845.55        3119