BeautifulSoup을 사용하여 HTML 테이블을 데이터 프레임으로 스크랩
Python에는 프로젝트 요구 사항을 고려하여 작업할 수 있는 다양한 패키지가 있습니다. 하나는 HTML 및 XML 문서를 구문 분석하는 데 사용되는 BeautifulSoup입니다.
웹 스크래핑에 유용한 HTML에서 정보(데이터)를 추출하는 데 사용할 수 있는 구문 분석된 페이지에 대한 구문 분석 트리를 생성합니다. 오늘의 튜토리얼은 BeautifulSoup 패키지를 사용하여 HTML 테이블을 데이터 프레임으로 긁어내는 방법을 알려줍니다.
BeautifulSoup을 사용하여 HTML 테이블을 데이터 프레임으로 스크래핑
매번 정리되고 정리된 데이터를 항상 얻을 필요는 없습니다.
때로는 웹사이트에서 사용할 수 있는 데이터가 필요합니다. 이를 위해서는 수집할 수 있어야 합니다.
다행스럽게도 Python의 BeautifulSoup 패키지에 솔루션이 있습니다. 이 패키지를 사용하여 테이블을 데이터 프레임으로 긁어내는 방법을 알아보겠습니다.
먼저 이 패키지를 Python 스크립트로 가져올 수 있도록 컴퓨터에 이 패키지를 설치해야 합니다. pip 명령을 사용하여 Windows 운영 체제에 BeautifulSoup을 설치할 수 있습니다.
pip install beautifulsoup
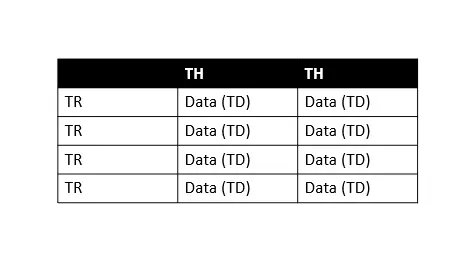
자세한 내용은 이 문서를 참조하십시오. 스크랩하는 동안 알아야 할 중요한 HTML 테이블의 기본 구조에 익숙하지 않다는 것을 알고 있습니다. 이 튜토리얼을 따라가는 것을 이해합시다.
위 표에서 TH는 테이블 헤더를 의미하고 TR은 테이블 행을 의미하며 TD는 테이블 데이터(셀이라고 함)를 의미합니다. 모든 테이블 행에는 여러 테이블 데이터가 있으므로 각 행을 쉽게 반복하여 정보를 추출할 수 있습니다.
이제 차근차근 배워보도록 하겠습니다.
-
라이브러리 가져오기
import requests
import pandas as pd
from bs4 import BeautifulSoup
먼저 데이터 프레임 작업을 위한
pandas라이브러리, 데이터 스크래핑을 위한bs4(beautiful soup), Python을 사용하여 HTTP 요청을 만들기 위한requests라이브러리 등 모든 라이브러리를 가져와야 합니다. -
웹 페이지에서 콘텐츠 다운로드
web_url = "https://pt.wikipedia.org/wiki/Lista_de_bairros_de_Manaus"
data = requests.get(web_url).text
# data
# print(data)
# print(type(data))
여기에서
web_url변수에 필요한 URL을 저장하고requests모듈을 사용하여 HTTP 요청을 만듭니다.requests모듈의.get()을 사용하여 지정된web_url에서 데이터를 검색하고.text는 데이터를 문자열로 검색한다는 의미입니다.따라서
print(type(data))로 인쇄하면 전체 페이지의 HTML을 문자열로 검색한 것을 볼 수 있습니다.data,print(data)및print(type(data))를 인쇄하여 놀 수 있습니다.이 모든 것은 위의 코드 펜스에 있습니다. 주석을 제거하고 연습할 수 있습니다.
-
BeautifulSoup객체 생성beautiful_soup = BeautifulSoup(data, "html.parser") # print(type(beautiful_soup.b))BeautifulSoup개체(beautiful_soup)는 구문 분석된 전체 문서를 나타냅니다. 따라서 스크랩하려는 완전한 문서라고 할 수 있습니다.대부분
Tag객체로 취급하며print(type(beautiful_soup.b))문으로도 확인할 수 있습니다. 이제 필요한 페이지의 완전한 HTML이 있습니다.다음 단계는 원하는 테이블을 파악하는 것입니다. 첫 번째 테이블에서 정보를 얻을 수 있지만 동일한 웹 페이지에 여러 테이블이 있을 가능성이 있습니다.
따라서 스크랩하려는 필수 테이블을 찾는 것이 중요합니다. 어떻게? 소스 코드를 검사하면 쉽게 할 수 있습니다.
이를 위해 필요한 웹 페이지에서 아무 곳이나
마우스 오른쪽 버튼으로 클릭하고검사를 선택한 다음 Ctrl+Shift+C를 눌러 선택합니다. 요소(다음 스크린샷에서 빨간색으로 강조 표시됨), 검색 상자를 사용하여 특정 태그를 찾을 수도 있습니다(다음 스크린샷에서 녹색으로 강조 표시됨).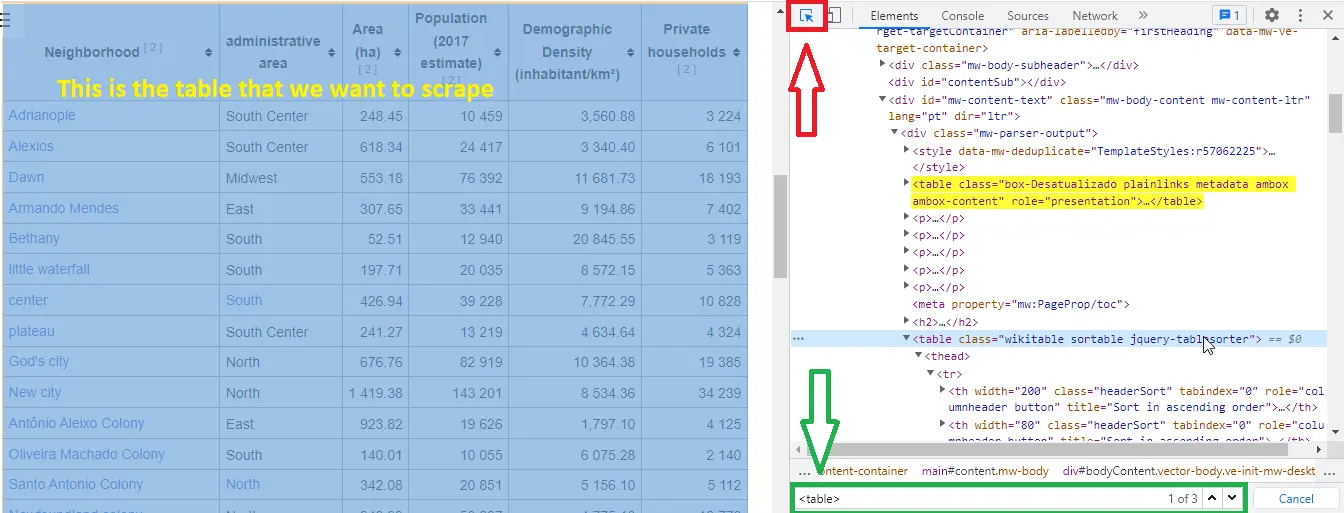
세 개의 테이블이 있습니다. 위의 스크린샷에 표시된 것처럼(검색 상자에서 녹색으로 강조 표시된 이 숫자 참조)
class="wikitable sortable jquery-tablesorter"와 함께 강조 표시된 테이블을 사용하고 있습니다.요점은 테이블을 선택하기 위해 왜
class속성을 사용하는 것입니까? 테이블에 제목이 없고class속성이 있기 때문입니다. -
클래스로 테이블 확인
print("Classes of Every table:")
for table in beautiful_soup.find_all("table"):
    print(table.get("class"))
출력:
Classes of Every table:
['box-Desatualizado', 'plainlinks', 'metadata', 'ambox', 'ambox-content']
['wikitable', 'sortable']
['nowraplinks', 'collapsible', 'collapsed', 'navbox-inner']
여기서는 모든
<table>요소를 반복하여class속성을 가져와 해당 클래스를 찾습니다. -
wikitable및sortable클래스 검색tables = beautiful_soup.find_all("table") table = beautiful_soup.find("table", class_="wikitable sortable")먼저 모든 테이블의 목록을 만든 다음
wikitable및sortable클래스가 있는 테이블을 찾습니다. -
데이터 프레임 생성 및 채우기
df = pd.DataFrame( columns=["Neighborhood", "Zone", "Area", "Population", "Density", "Homes_count"] ) mylist = [] for table_row in table.tbody.find_all("tr"): table_columns = table_row.find_all("td") if table_columns != []: neighbor = table_columns[0].text.strip() zone = table_columns[1].text.strip() area = table_columns[2].span.contents[0].strip("&0.") population = table_columns[3].span.contents[0].strip("&0.") density = table_columns[4].span.contents[0].strip("&0.") home_count = table_columns[5].span.contents[0].strip("&0.") mylist.append([neighbor, zone, area, population, density, home_count]) df = pd.DataFrame( mylist, columns=["Neighborhood", "Zone", "Area", "Population", "Density", "Homes_count"], )여기에서
Neighborhood,Zone,Area,Population,Density및Homes_count열이 있는 데이터 프레임을 정의합니다. 그런 다음 HTML 테이블을 반복하여 데이터를 검색하고 방금 정의한 데이터 프레임을 채웁니다. -
df.head()를 사용하여 처음 5개 문서 인쇄print(df.head())출력:
Neighborhood Zone Area Population Density Homes_count 0 Adrianópolis Centro-Sul 248.45 10459 3560.88 3224 1 Aleixo Centro-Sul 618.34 24417 3340.4 6101 2 Alvorada Centro-Oeste 553.18 76392 11681.73 18193 3 Armando Mendes Leste 307.65 33441 9194.86 7402 4 Betânia Sul 52.51 1294 20845.55 3119
완전한 소스 코드:
import requests
import pandas as pd
from bs4 import BeautifulSoup
web_url = "https://pt.wikipedia.org/wiki/Lista_de_bairros_de_Manaus"
data = requests.get(web_url).text
beautiful_soup = BeautifulSoup(data, "html.parser")
print("Classes of Every table:")
for table in beautiful_soup.find_all("table"):
print(table.get("class"))
tables = beautiful_soup.find_all("table")
table = beautiful_soup.find("table", class_="wikitable sortable")
df = pd.DataFrame(
    columns=["Neighborhood", "Zone", "Area", "Population", "Density", "Homes_count"]
)

mylist = []
for table_row in table.tbody.find_all("tr"):
    table_columns = table_row.find_all("td")

    if table_columns != []:
        neighbor = table_columns[0].text.strip()
        zone = table_columns[1].text.strip()
        area = table_columns[2].span.contents[0].strip("&0.")
        population = table_columns[3].span.contents[0].strip("&0.")
        density = table_columns[4].span.contents[0].strip("&0.")
        home_count = table_columns[5].span.contents[0].strip("&0.")

        mylist.append([neighbor, zone, area, population, density, home_count])

df = pd.DataFrame(
    mylist,
    columns=["Neighborhood", "Zone", "Area", "Population", "Density", "Homes_count"],
)
print(df.head())
출력:
Classes of Every table:
['box-Desatualizado', 'plainlinks', 'metadata', 'ambox', 'ambox-content']
['wikitable', 'sortable']
['nowraplinks', 'collapsible', 'collapsed', 'navbox-inner']
   Neighborhood          Zone    Area Population   Density Homes_count
0    Adrianópolis    Centro-Sul 248.45      10459   3560.88        3224
1          Aleixo    Centro-Sul 618.34      24417    3340.4        6101
2        Alvorada Centro-Oeste 553.18      76392 11681.73       18193
3 Armando Mendes         Leste 307.65      33441   9194.86        7402
4         Betânia           Sul   52.51       1294 20845.55        3119