How to Create Charts Using Node.js
This guide will teach how to use the Node.js charting library to produce impressive charts.
Numerous libraries for creating visual representations of data already exist because of billboard.js ease of use and straightforward design.
Overview of billboard.js
The Billboard charts inspired the naming of the chart library known as billboard.js. The billboard.js is an advanced, reusable, and aesthetically pleasing interface chart framework built on top of D3 v4+.
It is a JavaScript package that allows developers to immediately generate a chart to view data.
Prerequisites for billboard.js
We will need the following to utilize the billboard.js library:
Node.jsversion10or later andnpm versions 5.2or later must be installed on the system.- A fundamental understanding of
HTML,JavaScript, and how to work with libraries is required.
Using one of the CDNs, we won’t need to install the billboard.js library to utilize it. We can use npm to install the billboard.js library.
- Navigate the terminal to the location where we save our project files.
- Running the following command will generate the
package.jsonandpackage.lock.jsonfiles required byNode.jsfor managing third-party libraries used byNode.jsprojects.
$ npm init
$ npm install billboard.js
Example to Implement Chart Using Node.js
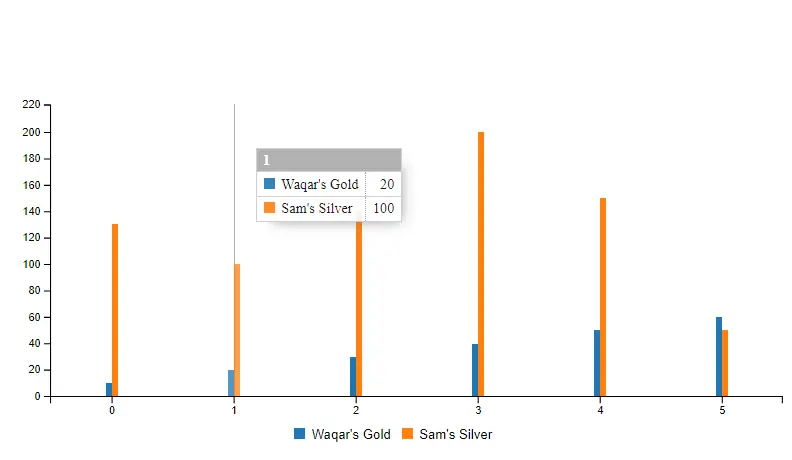
The following code snippet will generate a bar chart with two data values, Waqar's Gold and Sam's Silver.
-
chart.htmlIn the
chart.htmltemplate, create adivwith the idbarChart_1and place it inside thebodytag.<!-- Load D3.js --> <script src="https://d3js.org/d3.v4.min.js"></script> <!-- Load billboard.js with style --> <script src="https://cdnjs.cloudflare.com/ajax/libs/billboard.js/1.4.1/billboard.min.js"></script> <link rel="stylesheet" href="https://cdnjs.cloudflare.com/ajax/libs/billboard.js/1.4.1/billboard.css"> <div id="barChart_1"></div> -
chart.jsIn this example, the inputs supplied to
bb.generate()cause it to build a chart.var chart = bb.generate();The variable, known as
data, stores an object containing all the information necessary to generate the chart.
```javascript
data: {columns: [
         ['Waqar\'s Gold', 10, 20, 30, 40, 50, 60],
         ['Sam\'s Silver', 130, 100, 140, 200, 150, 50]
       ],
```

The term `"type"` denotes the particular kind of chart that will be used. In our example, we used to create a Bar Chart.

```javascript
type: 'bar'
}
, bar: {width: {ratio: 0.1}}
```

<!--adsense-->

The `bindto: "#barChart_1"` stores the div `id` in our `HTML` file corresponding to the location where the chart will be shown.

```javascript
bindto: '#barChart_1';
```
Complete Source Code:
chart.html:
<div id="barChart_1"></div>
chart.js:
var chart = bb.generate({
  data: {
    columns: [
      ['Waqar\'s Gold', 10, 20, 30, 40, 50, 60],
      ['Sam\'s Silver', 130, 100, 140, 200, 150, 50],
    ],
    type: 'bar',
  },
  bar: {
    width: {
      ratio: 0.1,
    },
  },
  bindto: '#barChart_1',
});
Output:

I am Waqar having 5+ years of software engineering experience. I have been in the industry as a javascript web and mobile developer for 3 years working with multiple frameworks such as nodejs, react js, react native, Ionic, and angular js. After which I Switched to flutter mobile development. I have 2 years of experience building android and ios apps with flutter. For the backend, I have experience with rest APIs, Aws, and firebase. I have also written articles related to problem-solving and best practices in C, C++, Javascript, C#, and power shell.
LinkedIn