Node.js를 사용하여 차트 만들기
이 가이드는 Node.js 차트 작성 라이브러리를 사용하여 인상적인 차트를 생성하는 방법을 알려줍니다.
billboard.js의 사용 용이성과 간단한 디자인으로 인해 데이터의 시각적 표현을 생성하기 위한 수많은 라이브러리가 이미 존재합니다.
billboard.js 개요
빌보드 차트는 billboard.js로 알려진 차트 라이브러리의 이름에 영감을 주었습니다. billboard.js는 D3 v4+를 기반으로 구축된 고급스럽고 재사용 가능하며 심미적으로 만족스러운 인터페이스 차트 프레임워크입니다.
개발자가 즉시 차트를 생성하여 데이터를 볼 수 있는 JavaScript 패키지입니다.
bilboard.js의 전제 조건
billboard.js 라이브러리를 활용하려면 다음이 필요합니다.
Node.js버전10이상 및npm 버전 5.2이상이 시스템에 설치되어 있어야 합니다.HTML,JavaScript및 라이브러리 작업 방법에 대한 기본적인 이해가 필요합니다.
CDN 중 하나를 사용하면 이를 활용하기 위해 billboard.js 라이브러리를 설치할 필요가 없습니다. npm을 사용하여 billboard.js 라이브러리를 설치할 수 있습니다.
- 프로젝트 파일을 저장한 위치로 터미널을 이동합니다.
- 다음 명령을 실행하면
Node.js프로젝트에서 사용하는 타사 라이브러리를 관리하기 위해Node.js에 필요한package.json및package.lock.json파일이 생성됩니다.
$ npm init
$ npm install billboard.js
Node.js를 사용하여 차트를 구현하는 예
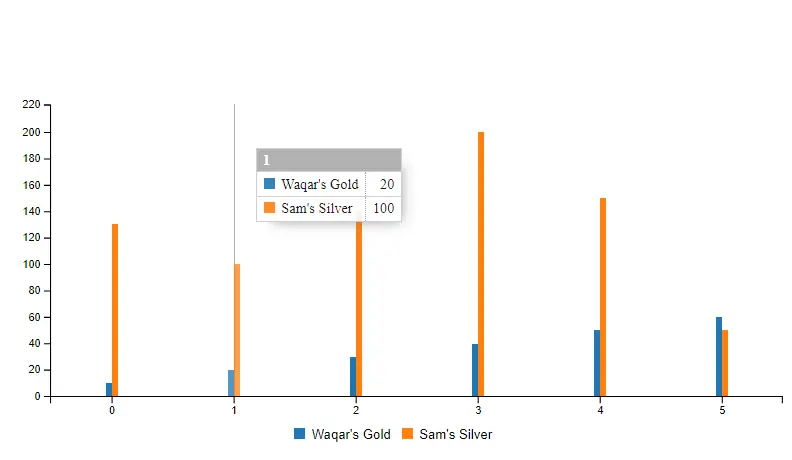
다음 코드 스니펫은 Waqar's Gold 및 Sam's Silver라는 두 개의 데이터 값이 있는 막대 차트를 생성합니다.
-
차트.htmlchart.html템플릿에서 id가barChart_1인div를 만들고body태그 안에 배치합니다.<!-- Load D3.js --> <script src="https://d3js.org/d3.v4.min.js"></script> <!-- Load billboard.js with style --> <script src="https://cdnjs.cloudflare.com/ajax/libs/billboard.js/1.4.1/billboard.min.js"></script> <link rel="stylesheet" href="https://cdnjs.cloudflare.com/ajax/libs/billboard.js/1.4.1/billboard.css"> <div id="barChart_1"></div> -
chart.js이 예에서
bb.generate()에 제공된 입력으로 인해 차트가 작성됩니다.var chart = bb.generate();데이터로 알려진 변수는 차트를 생성하는 데 필요한 모든 정보를 포함하는 개체를 저장합니다.
```javascript
data: {columns: [
         ['Waqar\'s Gold', 10, 20, 30, 40, 50, 60],
         ['Sam\'s Silver', 130, 100, 140, 200, 150, 50]
       ],
```

`"유형"`이라는 용어는 사용될 특정 종류의 차트를 나타냅니다. 이 예에서는 막 대형 차트를 만드는 데 사용했습니다.

```javascript
type: 'bar'
}
, bar: {width: {ratio: 0.1}}
```

<!--adsense-->

`bindto: "#barChart_1"`은 차트가 표시될 위치에 해당하는 `HTML` 파일에 div `id`를 저장합니다.

```javascript
bindto: '#barChart_1';
```
완전한 소스 코드:
차트.html:
<div id="barChart_1"></div>
차트.js:
var chart = bb.generate({
  data: {
    columns: [
      ['Waqar\'s Gold', 10, 20, 30, 40, 50, 60],
      ['Sam\'s Silver', 130, 100, 140, 200, 150, 50],
    ],
    type: 'bar',
  },
  bar: {
    width: {
      ratio: 0.1,
    },
  },
  bindto: '#barChart_1',
});
출력:

I am Waqar having 5+ years of software engineering experience. I have been in the industry as a javascript web and mobile developer for 3 years working with multiple frameworks such as nodejs, react js, react native, Ionic, and angular js. After which I Switched to flutter mobile development. I have 2 years of experience building android and ios apps with flutter. For the backend, I have experience with rest APIs, Aws, and firebase. I have also written articles related to problem-solving and best practices in C, C++, Javascript, C#, and power shell.
LinkedIn