Interactive Sliders in Matplotlib
This tutorial teaches you how to place the slider in your Plots and make the interactive. Before working with plots, we need to set up our script to work with the library.
Start by importing Matplotlib, and we load the randrange function from the random module to quickly generate some data. Keep in mind that the output will look different for you.
import matplotlib.pyplot as plt
from random import randrange

data_1 = [randrange(0, 10) for _ in range(0, 10)]

fig, ax = plt.subplots()
(p,) = ax.plot(data_1)
Place Slider Widget Below Plot in Matplotlib
The following code shows how we place the Slider widget of the Matplotlib Library in our plot.
In the first line, we create some axes which describe where the slider will be placed. Consult the Axes Docs Page to see what the numbers do.
Next, we make a new slider object and fill out some parameters. The first one is the placement and dimensions of the slider, and we label it in the second argument.
The next parameters describe the slider, valmin is the lowest value, valmax is the highest value and valinit is the starting value. Lastly, we adjust the plot position, so the plot and the slider don’t overlap.
Code:
axfreq = plt.axes([0.1, 0.1, 0.8, 0.05])
slider = Slider(
    ax=axfreq,
    label="Offset",
    valmin=-5,
    valmax=5,
    valinit=0,
)
plt.subplots_adjust(left=0.1, bottom=0.25)
plt.show()
Output:
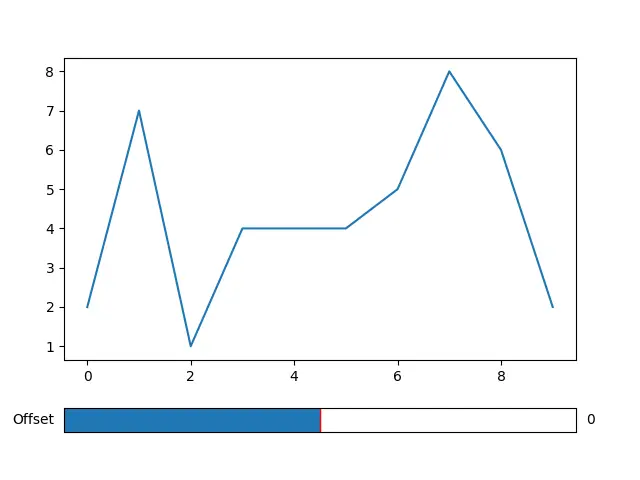
As you see, there is a Slider below the plot. You can slide it, but nothing happens because it’s on change event isn’t connected to anything.
We’ll take a look at this in the next part.
Connect Slider Event With Function in Matplotlib
To Capture Slide changes, we need to connect the Slider onchange event to a function. We will call the on_changed function on the slider, which should be executed when something happens.
Remember to leave out the parentheses because you only pass the function object. The val parameter in the update function will get the slider value.
def update(val):
    # Update Code ...


slider.on_changed(update)
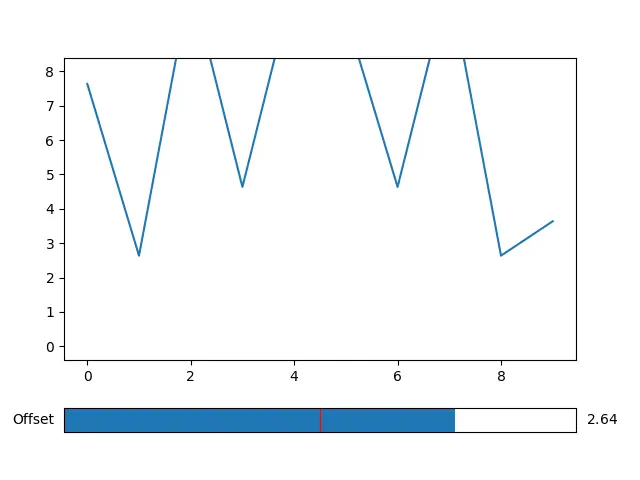
Now we want to change the plot when we use the slider. In this example, we simply lower or raise the plotlines with these two lines of code.
After creating them with the set_ydata, set_data, or set_data functions, you can change plots.
def update(val):
    data_2 = [x + val for x in data_1]
    p.set_ydata(data_2)
After running this code and playing with the slider, you could see something like this.
Output:
Now we learned how to Place widgets in your plot, how to connect the to a function, and how to change a plot.
Complete Code:
import matplotlib.pyplot as plt
from matplotlib.widgets import Slider
from random import randrange

data_1 = [randrange(0, 10) for _ in range(0, 10)]
data_2 = [randrange(0, 10) for _ in range(0, 10)]

fig, ax = plt.subplots()
(p,) = ax.plot(data_1)

plt.subplots_adjust(left=0.1, bottom=0.25)

axfreq = plt.axes([0.1, 0.1, 0.8, 0.05])
slider = Slider(
    ax=axfreq,
    label="Offset",
    valmin=-5,
    valmax=5,
    valinit=0,
)


def update(val):
    data_2 = [x + val for x in data_1]
    p.set_ydata(data_2)


slider.on_changed(update)
plt.show()

Hi, my name is Maxim Maeder, I am a young programming enthusiast looking to have fun coding and teaching you some things about programming.
GitHub