No Handles With Labels Found to Put in Legend
- No Handles With Labels Found to Put in Legend
-
Solve
No handles with labels found to put in legendin Matplotlib
This article demonstrates how we can solve the warning No handles with labels found to put in legend when trying to plot something using Matplotlib.
No Handles With Labels Found to Put in Legend
Used extensively in various applications, Matplotlib is a Python library that aims to give users functionality similar to that of MATLAB to a certain degree. It creates static, animated, and interactive visualizations of data for analysis and other purposes.
While trying to plot something using Matplotlib, it is a common occurrence that we may want to label specific parts of our visualization graphs, be it for understanding or some other reason. During this process, we may encounter a warning hinting that a legend could not be created due to some error.
Consider the following code.
import matplotlib.pyplot as plt

fig = plt.figure()

ax = fig.add_subplot(111)
ax.spines["left"].set_position("zero")
ax.spines["right"].set_color("none")
ax.spines["bottom"].set_position("zero")
ax.spines["top"].set_color("none")

plt.axis([-5, 5, -5, 5])

ax.xaxis.set_ticks_position("bottom")
ax.yaxis.set_ticks_position("left")

plt.grid()

plt.arrow(0, 0, 3, 1, head_width=0.2, color="r", length_includes_head=True)
plt.arrow(0, 0, 1, 3, head_width=0.2, color="g", length_includes_head=True)
plt.arrow(0, 0, 4, 4, head_width=0.2, color="b", length_includes_head=True)

plt.legend()
plt.show()
Upon execution of the program, we see the following output.
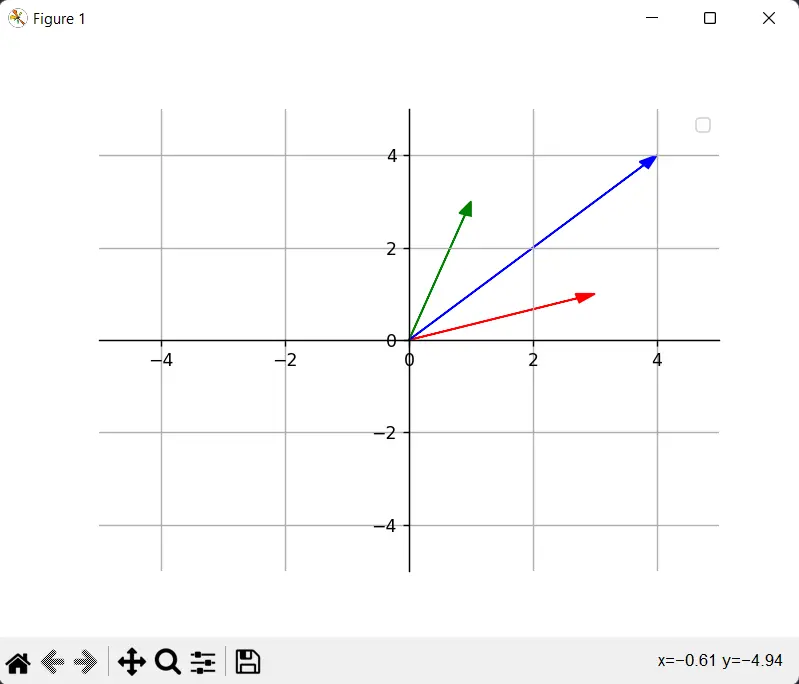
In the code mentioned above, when trying to plot the graph, we receive an error, which is given as:
No artists with labels found to put in legend. Note that artists whose label start with an underscore are ignored when legend() is called with no argument.
Note: In recent updates, the warning now starts with No artists instead of No handles.
As evident from the output image, it can be seen that no legend was generated; instead of the labels, we only see the plots.
Solve No handles with labels found to put in legend in Matplotlib
The warning occurs if you have not provided the label parameters before calling the legend() method on a plotted figure.
pyplot is a state-based interface to Matplotlib that enables interactive figure plotting in Python. The legend() method can add a legend to the axes.
However, if we omit the labels option and then call the legend() function, we will receive the error message.
No artists with labels found to put in legend. Note that artists whose label start with an underscore are ignored when `legend()` is called with no argument.
Following are some scenarios where this warning pops up.
Cause 1: No Labels Were Declared
It can be the case that the labels that were supposed to be included in the legend were not declared in the first place.
Consider the following example.
plt.arrow(0, 0, 3, 1, head_width=0.2, color="r", length_includes_head=True)
plt.arrow(0, 0, 1, 3, head_width=0.2, color="g", length_includes_head=True)
plt.arrow(0, 0, 4, 4, head_width=0.2, color="b", length_includes_head=True)
In the arrows declaration above, none of them was assigned any labels, which can result in the legend not finding the labels which are supposed to be added to the legend.
The fix, in our case, is simple, add the labels to the arrows.
plt.arrow(0, 0, 3, 1, head_width=0.2, color="r", length_includes_head=True, label="u")
plt.arrow(0, 0, 1, 3, head_width=0.2, color="g", length_includes_head=True, label="v")
plt.arrow(0, 0, 4, 4, head_width=0.2, color="b", length_includes_head=True, label="u+v")
Instead of declaring labels inside the plt.arrow() method, we can also declare the labels by passing them on to the plt.legend() function itself.
The plt.legend() method takes either a list or tuple containing the necessary labels you may want to declare in your plot.
Consider the example below.
plt.arrow(0, 0, 3, 1, head_width=0.2, color="r", length_includes_head=True)
plt.arrow(0, 0, 1, 3, head_width=0.2, color="g", length_includes_head=True)
plt.arrow(0, 0, 4, 4, head_width=0.2, color="b", length_includes_head=True)

plt.legend(["u", "v", "u+v"])
Now that the labels have been defined, the warning will not show up, and our graph will be plotted successfully, as shown below.
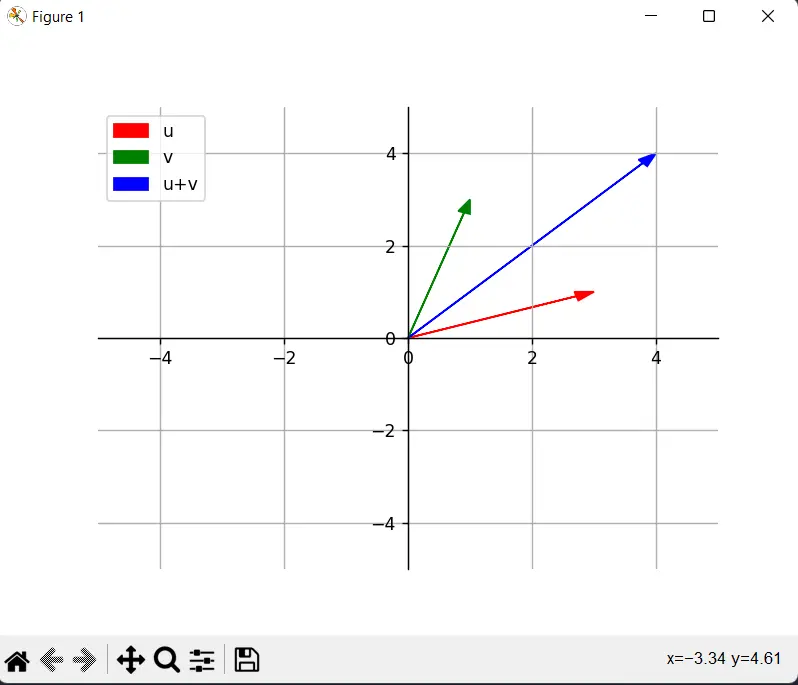
It can be quite a common mistake that we sometimes forget to declare the labels for legend. It is a good practice to declare the labels whenever we declare the elements of the graph; this approach helps reduce the chances of missing the declaration of a certain label.
As seen from the code, matplotlib allows the declaration of labels as arguments to several functions which create different plot elements (plt.arrow() in our case).
Cause 2: Plot Made After Legend
Another root cause of this issue can be that the order in which the graph should be plotted correctly is not followed correctly; for example, if a legend is created before creating the plot, the warning will still pop up, and the legend will not be made.
Consider the following code.
plt.legend()  # Wrong Placement

plt.arrow(0, 0, 3, 1, head_width=0.2, color="b", length_includes_head=True)
plt.arrow(0, 0, 3, 4, head_width=0.2, color="g", length_includes_head=True)
Here we have called the legend() function before actually creating the plot itself; since no labels (or plots) were declared when the legend() function gets called, the warning will show up, and the legend will remain empty.
To fix this, make sure that legend() is called. Every aspect of the graph has been plotted with suitable labels.
In our case, that would be:
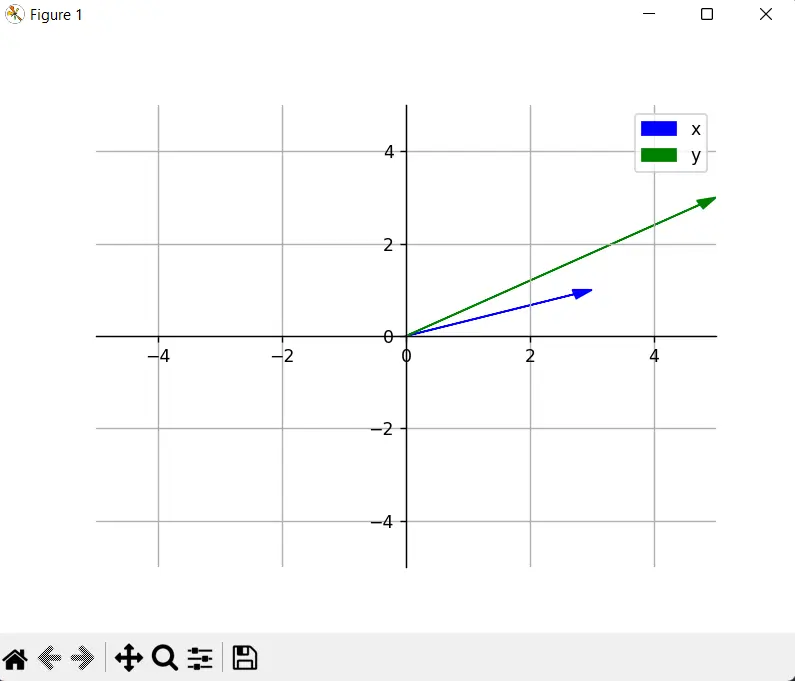
plt.arrow(0, 0, 3, 1, head_width=0.2, color="b", length_includes_head=True, label="x")
plt.arrow(0, 0, 3, 4, head_width=0.2, color="g", length_includes_head=True, label="y")

plt.legend()  # Correct placement
Now that the order of plt.legend() has been fixed, the plot will contain the defined legend.
Full Code:
import matplotlib.pyplot as plt

fig = plt.figure()

ax = fig.add_subplot(111)

ax.spines["left"].set_position("zero")
ax.spines["right"].set_color("none")
ax.spines["bottom"].set_position("zero")
ax.spines["top"].set_color("none")

plt.axis([-5, 5, -5, 5])

ax.xaxis.set_ticks_position("bottom")
ax.yaxis.set_ticks_position("left")

plt.grid()

plt.arrow(0, 0, 3, 1, head_width=0.2, color="r", length_includes_head=True, label="u")
plt.arrow(0, 0, 1, 3, head_width=0.2, color="g", length_includes_head=True, label="v")
plt.arrow(0, 0, 4, 4, head_width=0.2, color="b", length_includes_head=True, label="u+v")

plt.legend()
# plt.legend(['u','v','u+v'])
plt.show()

Hello! I am Salman Bin Mehmood(Baum), a software developer and I help organizations, address complex problems. My expertise lies within back-end, data science and machine learning. I am a lifelong learner, currently working on metaverse, and enrolled in a course building an AI application with python. I love solving problems and developing bug-free software for people. I write content related to python and hot Technologies.
LinkedIn