범례에 넣을 레이블이 있는 핸들이 없습니다.
이 기사는 Matplotlib를 사용하여 무언가를 플롯하려고 할 때 범례에 넣을 레이블이 있는 핸들이 없습니다라는 경고를 해결하는 방법을 보여줍니다.
범례에 넣을 레이블이 있는 핸들이 없습니다.
다양한 응용 프로그램에서 광범위하게 사용되는 Matplotlib는 어느 정도 MATLAB과 유사한 기능을 사용자에게 제공하는 것을 목표로 하는 Python 라이브러리입니다. 분석 및 기타 목적을 위해 데이터의 정적, 애니메이션 및 대화형 시각화를 생성합니다.
Matplotlib를 사용하여 무언가를 플롯하려고 시도하는 동안 이해를 위해 또는 다른 이유로 시각화 그래프의 특정 부분에 레이블을 지정하려는 경우가 일반적입니다. 이 과정에서 일부 오류로 인해 범례를 생성할 수 없다는 경고가 표시될 수 있습니다.
다음 코드를 고려하십시오.
import matplotlib.pyplot as plt

fig = plt.figure()

ax = fig.add_subplot(111)
ax.spines["left"].set_position("zero")
ax.spines["right"].set_color("none")
ax.spines["bottom"].set_position("zero")
ax.spines["top"].set_color("none")

plt.axis([-5, 5, -5, 5])

ax.xaxis.set_ticks_position("bottom")
ax.yaxis.set_ticks_position("left")

plt.grid()

plt.arrow(0, 0, 3, 1, head_width=0.2, color="r", length_includes_head=True)
plt.arrow(0, 0, 1, 3, head_width=0.2, color="g", length_includes_head=True)
plt.arrow(0, 0, 4, 4, head_width=0.2, color="b", length_includes_head=True)

plt.legend()
plt.show()
프로그램을 실행하면 다음과 같은 출력이 표시됩니다.
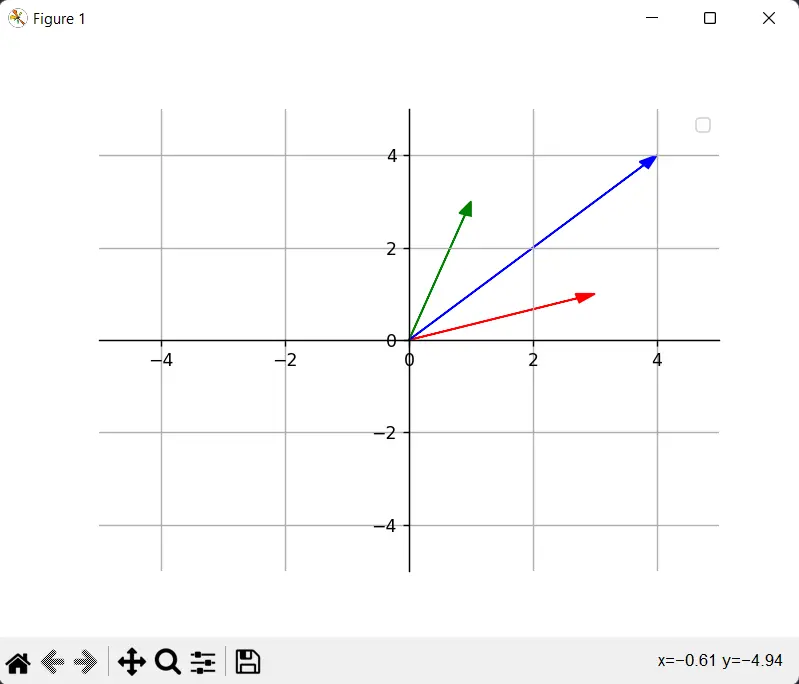
위에서 언급한 코드에서 그래프를 그리려고 하면 다음과 같은 오류가 발생합니다.
No artists with labels found to put in legend. Note that artists whose label start with an underscore are ignored when legend() is called with no argument.
참고: 최근 업데이트에서 경고는 이제 핸들 없음 대신 아티스트 없음으로 시작합니다.
출력 이미지에서 알 수 있듯이 범례가 생성되지 않았음을 알 수 있습니다. 레이블 대신 플롯만 표시됩니다.
Matplotlib에서 범례에 넣을 레이블이 있는 핸들이 없음 해결
플로팅된 그림에서 legend() 메서드를 호출하기 전에 label 매개변수를 제공하지 않은 경우 경고가 발생합니다.
pyplot은 Python에서 대화형 그림 플로팅을 가능하게 하는 Matplotlib에 대한 상태 기반 인터페이스입니다. legend() 메서드는 좌표축에 범례를 추가할 수 있습니다.
그러나 labels 옵션을 생략하고 legend() 함수를 호출하면 오류 메시지가 표시됩니다.
No artists with labels found to put in legend. Note that artists whose label start with an underscore are ignored when `legend()` is called with no argument.
다음은 이 경고가 나타나는 몇 가지 시나리오입니다.
원인 1: 레이블이 선언되지 않았습니다.
범례에 포함되어야 할 레이블이 애초에 선언되지 않은 경우일 수 있습니다.
다음 예를 고려하십시오.
plt.arrow(0, 0, 3, 1, head_width=0.2, color="r", length_includes_head=True)
plt.arrow(0, 0, 1, 3, head_width=0.2, color="g", length_includes_head=True)
plt.arrow(0, 0, 4, 4, head_width=0.2, color="b", length_includes_head=True)
위의 화살표 선언에서는 레이블이 할당되지 않았으므로 범례에 추가해야 하는 레이블을 범례에서 찾지 못할 수 있습니다.
우리의 경우 해결 방법은 간단합니다. 화살표에 레이블을 추가하는 것입니다.
plt.arrow(0, 0, 3, 1, head_width=0.2, color="r", length_includes_head=True, label="u")
plt.arrow(0, 0, 1, 3, head_width=0.2, color="g", length_includes_head=True, label="v")
plt.arrow(0, 0, 4, 4, head_width=0.2, color="b", length_includes_head=True, label="u+v")
plt.arrow() 메서드 내에서 레이블을 선언하는 대신 plt.legend() 함수 자체에 레이블을 전달하여 레이블을 선언할 수도 있습니다.
plt.legend() 메서드는 플롯에서 선언하려는 필수 레이블이 포함된 목록 또는 튜플을 사용합니다.
아래 예를 고려하십시오.
plt.arrow(0, 0, 3, 1, head_width=0.2, color="r", length_includes_head=True)
plt.arrow(0, 0, 1, 3, head_width=0.2, color="g", length_includes_head=True)
plt.arrow(0, 0, 4, 4, head_width=0.2, color="b", length_includes_head=True)

plt.legend(["u", "v", "u+v"])
레이블이 정의되었으므로 경고가 표시되지 않고 아래와 같이 그래프가 성공적으로 그려집니다.
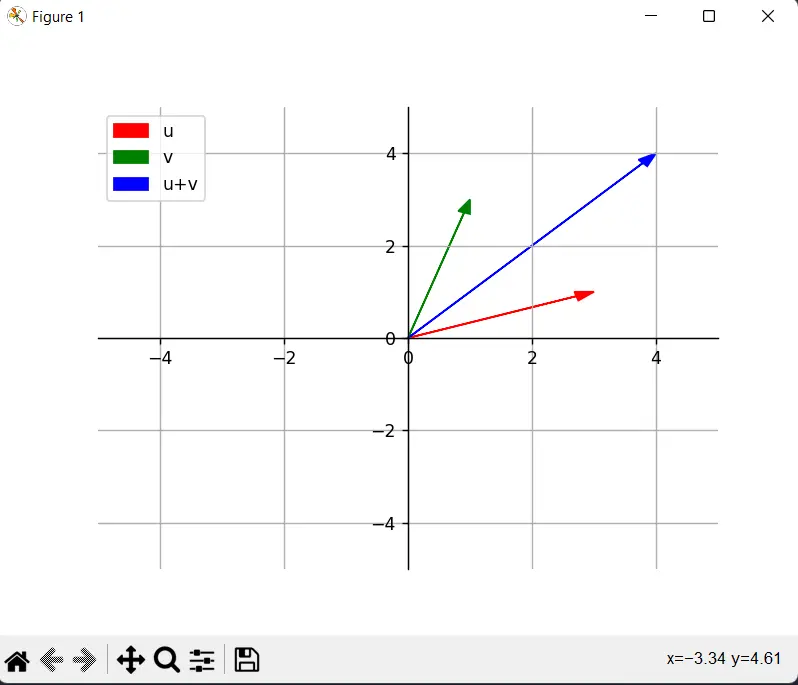
범례에 대한 레이블을 선언하는 것을 때때로 잊는 것은 꽤 흔한 실수일 수 있습니다. 그래프의 요소를 선언할 때마다 레이블을 선언하는 것이 좋습니다. 이 접근 방식은 특정 레이블 선언이 누락될 가능성을 줄이는 데 도움이 됩니다.
코드에서 볼 수 있듯이 matplotlib는 다른 플롯 요소를 생성하는 여러 함수(이 경우 plt.arrow())에 대한 인수로 레이블 선언을 허용합니다.
원인 2: 범례 이후에 만들어진 플롯
이 문제의 또 다른 근본 원인은 그래프를 올바르게 그려야 하는 순서를 올바르게 따르지 않는 것일 수 있습니다. 예를 들어 플롯을 생성하기 전에 범례를 생성하면 경고가 계속 표시되고 범례가 만들어지지 않습니다.
다음 코드를 고려하십시오.
plt.legend()  # Wrong Placement

plt.arrow(0, 0, 3, 1, head_width=0.2, color="b", length_includes_head=True)
plt.arrow(0, 0, 3, 4, head_width=0.2, color="g", length_includes_head=True)
여기서 실제로 플롯 자체를 생성하기 전에 legend() 함수를 호출했습니다. legend() 함수가 호출될 때 레이블(또는 플롯)이 선언되지 않았기 때문에 경고가 표시되고 범례는 비어 있습니다.
이를 수정하려면 legend()가 호출되는지 확인하십시오. 그래프의 모든 측면은 적절한 레이블로 표시되었습니다.
우리의 경우에는 다음과 같습니다.
plt.arrow(0, 0, 3, 1, head_width=0.2, color="b", length_includes_head=True, label="x")
plt.arrow(0, 0, 3, 4, head_width=0.2, color="g", length_includes_head=True, label="y")

plt.legend()  # Correct placement
이제 plt.legend()의 순서가 수정되었으므로 플롯에 정의된 범례가 포함됩니다.
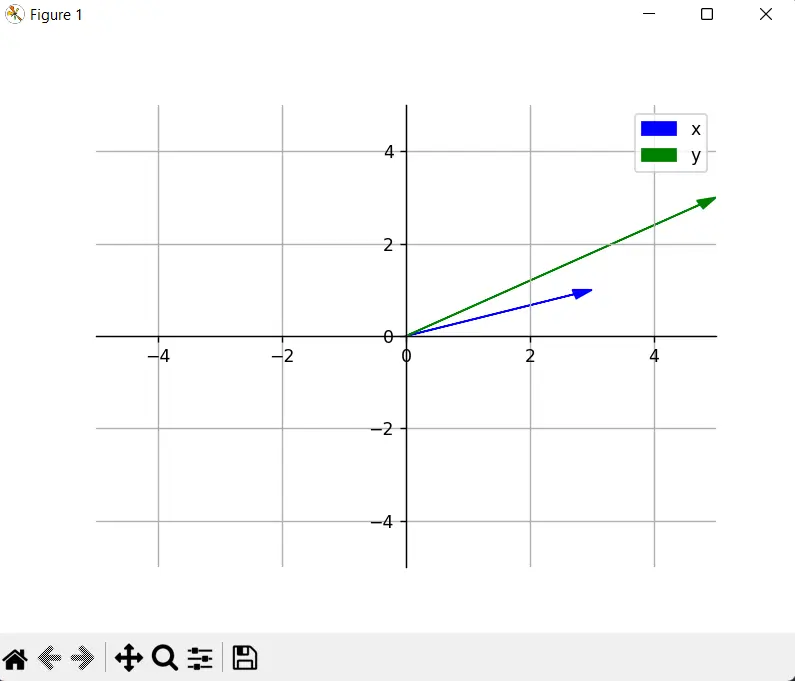
전체 코드:
import matplotlib.pyplot as plt

fig = plt.figure()

ax = fig.add_subplot(111)

ax.spines["left"].set_position("zero")
ax.spines["right"].set_color("none")
ax.spines["bottom"].set_position("zero")
ax.spines["top"].set_color("none")

plt.axis([-5, 5, -5, 5])

ax.xaxis.set_ticks_position("bottom")
ax.yaxis.set_ticks_position("left")

plt.grid()

plt.arrow(0, 0, 3, 1, head_width=0.2, color="r", length_includes_head=True, label="u")
plt.arrow(0, 0, 1, 3, head_width=0.2, color="g", length_includes_head=True, label="v")
plt.arrow(0, 0, 4, 4, head_width=0.2, color="b", length_includes_head=True, label="u+v")

plt.legend()
# plt.legend(['u','v','u+v'])
plt.show()

Hello! I am Salman Bin Mehmood(Baum), a software developer and I help organizations, address complex problems. My expertise lies within back-end, data science and machine learning. I am a lifelong learner, currently working on metaverse, and enrolled in a course building an AI application with python. I love solving problems and developing bug-free software for people. I write content related to python and hot Technologies.
LinkedIn