How to Plot Smooth Curve in Matplotlib
-
Plot Smooth Curve Using the
scipy.interpolate.make_interp_spline()Class -
Plot Smooth Curve Using the
scipy.ndimage.gaussian_filter1d()Class -
Plot Smooth Curve Using the
scipy.interpolate.interp1dClass
This tutorial explains how we can plot a smooth curve from given coordinates using the modules from the Scipy and Matplotlib package.
The matplotlib.pyplot.plot() function by default produces a curve by joining two adjacent points in the data with a straight line, and hence the matplotlib.pyplot.plot() function does not produce a smooth curve for a small number of data points.
To plot a smooth curve, we first fit a spline curve to the curve and use the curve to find the y-values for x values separated by an infinitesimally small gap. Finally, we get a smooth curve by plotting those points with a very small gap.
Plot Smooth Curve Using the scipy.interpolate.make_interp_spline() Class
import numpy as np
from scipy.interpolate import make_interp_spline
import matplotlib.pyplot as plt

x = np.array([1, 2, 3, 4, 5, 6, 7])
y = np.array([100, 50, 25, 12.5, 6.25, 3.125, 1.5625])

model = make_interp_spline(x, y)

xs = np.linspace(1, 7, 500)
ys = model(xs)

plt.plot(xs, ys)
plt.title("Smooth Spline Curve")
plt.xlabel("X")
plt.ylabel("Y")
plt.show()
Output:
-function.webp)
It plots a smooth spline curve by first determining the spline curve’s coefficients using the scipy.interpolate.make_interp_spline(). We use the given data to estimate the coefficients for the spline curve and then we use the coefficients to determine the y-values for closely spaced x-values to make the curve smooth. It takes 500 equally spaced between 1 and 7 along the X-axis to plot the curve.
By default, the degree of the spline curve is 3. We can set the k parameter to change the degree of the spline curve.
If we use the given points to plot the curve, we get the curve as:
import numpy as np
import matplotlib.pyplot as plt

x = np.array([1, 2, 3, 4, 5, 6, 7])
y = np.array([100, 50, 25, 12.5, 6.25, 3.125, 1.5625])

plt.plot(x, y)
plt.title("Curve plotted using the given points")
plt.xlabel("X")
plt.ylabel("Y")
plt.show()
Output:

Plot Smooth Curve Using the scipy.ndimage.gaussian_filter1d() Class
import numpy as np
import matplotlib.pyplot as plt
from scipy.ndimage import gaussian_filter1d

x = np.array([1, 2, 3, 4, 5, 6, 7])
y = np.array([100, 50, 25, 12.5, 6.25, 3.125, 1.5625])
y_smoothed = gaussian_filter1d(y, sigma=5)

plt.plot(x, y_smoothed)
plt.title("Spline Curve Using the Gaussian Smoothing")
plt.xlabel("X")
plt.ylabel("Y")
plt.show()
Output:
-function.webp)
If the function is not smooth, we can use the gaussian_filter1d() to make the Y-values smooth. The scipy.ndimage.gaussian_filter1d() class will smooth the Y-values to generate a smooth curve, but the original Y-values might get changed.
The sigma parameter represents the standard deviation for Gaussian kernel and we get a smoother curve upon increasing the value of sigma.
Plot Smooth Curve Using the scipy.interpolate.interp1d Class
import numpy as np
from scipy.interpolate import interp1d
import matplotlib.pyplot as plt

x = np.array([1, 2, 3, 4, 5, 6, 7])
y = np.array([100, 50, 25, 12.5, 6.25, 3.125, 1.5625])

cubic_interploation_model = interp1d(x, y, kind="cubic")
xs = np.linspace(1, 7, 500)
ys = cubic_interploation_model(xs)

plt.plot(xs, ys)
plt.title("Spline Curve Using Cubic Interpolation")
plt.xlabel("X")
plt.ylabel("Y")
plt.show()
Output:
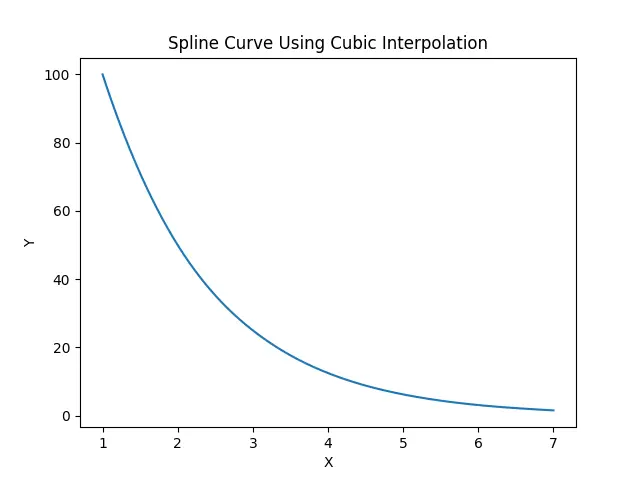
It generates a cubic interpolation curve using the scipy.interpolate.interp1d method, and then we use the curve to determine the y-values for closely spaced x-values for a smooth curve. To plot the curve, it takes 500 points equally spaced between 1 and 7 along the X-axis.

Suraj Joshi is a backend software engineer at Matrice.ai.
LinkedIn