Matplotlib 绘制平滑曲线
-
使用
scipy.interpolate.make_interp_spline()类绘制平滑曲线 -
使用
scipy.ndimage.gaussian_filter1d()类绘制平滑曲线 -
使用
scipy.interpolate.interp1d类绘制平滑曲线

本教程解释了如何使用 Scipy 和 Matplotlib 包中的模块从给定坐标绘制一条平滑的曲线。
默认情况下,matplotlib.pyplot.plot() 函数是通过将数据中相邻的两个点用直线连接起来产生曲线,因此 matplotlib.pyplot.plot() 函数对于少量的数据点并不能产生平滑曲线。
为了绘制一条平滑曲线,我们首先要对曲线拟合一条曲线,并利用曲线找到 x 值对应的 y 值,并以无限小的空隙分开。最后,我们通过绘制那些间隙很小的点,得到一条平滑曲线。
使用 scipy.interpolate.make_interp_spline() 类绘制平滑曲线
import numpy as np
from scipy.interpolate import make_interp_spline
import matplotlib.pyplot as plt

x = np.array([1, 2, 3, 4, 5, 6, 7])
y = np.array([100, 50, 25, 12.5, 6.25, 3.125, 1.5625])

model = make_interp_spline(x, y)

xs = np.linspace(1, 7, 500)
ys = model(xs)

plt.plot(xs, ys)
plt.title("Smooth Spline Curve")
plt.xlabel("X")
plt.ylabel("Y")
plt.show()
输出:
-function.webp)
它通过使用 scipy.interpolate.make_interp_spline() 首先确定花键曲线的系数,绘制出一条平滑的花键曲线。我们用给定的数据来估计花样曲线的系数,然后用系数来确定间隔紧密的 x 值的 y 值,使曲线平滑。绘制曲线需要沿 X 轴 1 到 7 之间间隔相等的 500。
默认情况下,花键曲线的度数是 3,我们可以设置 k 参数来改变花键曲线的度数。
如果我们使用给定的点来绘制曲线,我们得到的曲线为:
import numpy as np
import matplotlib.pyplot as plt

x = np.array([1, 2, 3, 4, 5, 6, 7])
y = np.array([100, 50, 25, 12.5, 6.25, 3.125, 1.5625])

plt.plot(x, y)
plt.title("Curve plotted using the given points")
plt.xlabel("X")
plt.ylabel("Y")
plt.show()
输出:

使用 scipy.ndimage.gaussian_filter1d() 类绘制平滑曲线
import numpy as np
import matplotlib.pyplot as plt
from scipy.ndimage import gaussian_filter1d

x = np.array([1, 2, 3, 4, 5, 6, 7])
y = np.array([100, 50, 25, 12.5, 6.25, 3.125, 1.5625])
y_smoothed = gaussian_filter1d(y, sigma=5)

plt.plot(x, y_smoothed)
plt.title("Spline Curve Using the Gaussian Smoothing")
plt.xlabel("X")
plt.ylabel("Y")
plt.show()
输出:
-function.webp)
如果函数不平滑,我们可以使用 gaussian_filter1d() 来使 Y 值平滑。scipy.ndimage.gaussian_filter1d() 类会对 Y 值进行平滑处理,生成一条平滑的曲线,但是原来的 Y 值可能会被改变。
sigma 参数代表高斯核的标准差,增加 sigma 的值会得到更平滑的曲线。
使用 scipy.interpolate.interp1d 类绘制平滑曲线
import numpy as np
from scipy.interpolate import interp1d
import matplotlib.pyplot as plt

x = np.array([1, 2, 3, 4, 5, 6, 7])
y = np.array([100, 50, 25, 12.5, 6.25, 3.125, 1.5625])

cubic_interploation_model = interp1d(x, y, kind="cubic")
xs = np.linspace(1, 7, 500)
ys = cubic_interploation_model(xs)

plt.plot(xs, ys)
plt.title("Spline Curve Using Cubic Interpolation")
plt.xlabel("X")
plt.ylabel("Y")
plt.show()
输出:
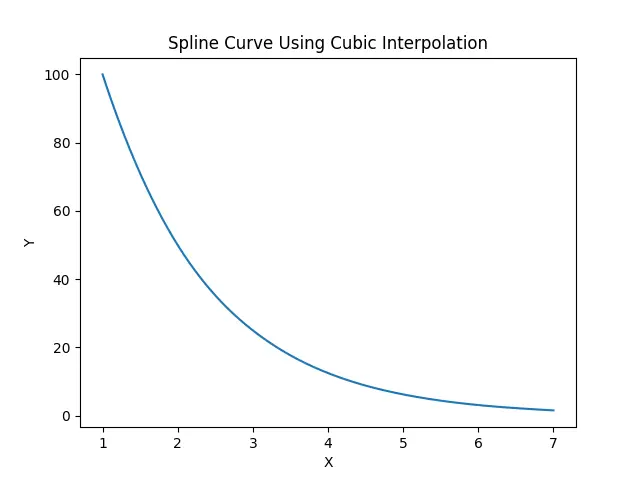
它使用 scipy.interpolate.interp1d 类生成一条立方插值曲线,然后我们使用这条曲线来确定间距紧密的 x 值,从而得到一条平滑的曲线。绘制曲线时,需要在 X 轴上 1 和 7 之间取间隔相等的 500 个点。

Suraj Joshi is a backend software engineer at Matrice.ai.
LinkedIn