Latex Formulas in Matplotlib
- Using LaTeX in Matplotlib Text
- Customizing LaTeX Rendering
- Adding Annotations with LaTeX
- Conclusion
- FAQ
Matplotlib is a powerful plotting library in Python that allows for the creation of a wide range of visualizations. One of its standout features is the ability to render LaTeX formulas and equations directly in plots. This capability is particularly useful for scientists, mathematicians, and engineers who want to present their work with precision and clarity.
In this tutorial, we will explore how to incorporate LaTeX into your Matplotlib visualizations. Whether you’re labeling axes, adding titles, or annotating data points, rendering LaTeX can elevate your plots to a professional level. Let’s dive into the methods to achieve this!
Using LaTeX in Matplotlib Text
To use LaTeX in Matplotlib, you first need to ensure that your environment supports LaTeX rendering. Matplotlib can use LaTeX to render text by setting a few parameters. Below is an example of how to set up your Matplotlib environment to use LaTeX and create a simple plot with LaTeX-rendered text.
import matplotlib.pyplot as plt
import numpy as np

x = np.linspace(0, 2 * math.pi, 100)
y = np.sin(x)

plt.plot(x, y)
plt.xlabel("x")
plt.ylabel(r"$\sin (x)$")
plt.title("Plot of sinx")
plt.show()
Output:
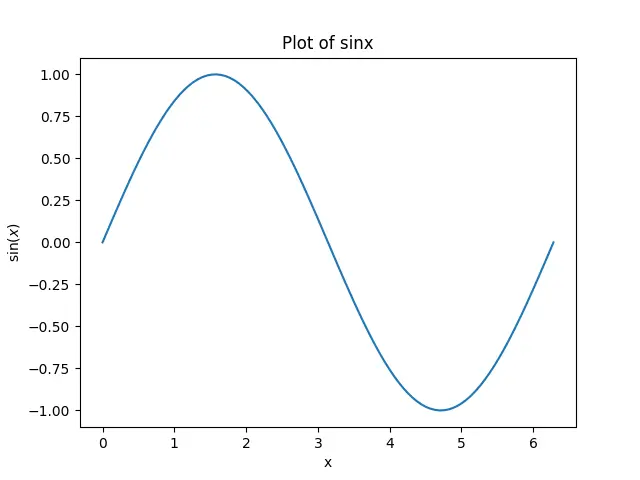
In this code, we start by importing the necessary libraries, matplotlib.pyplot and numpy. We create an array of x values ranging from 0 to 10 and compute the sine of these values to get y. The plt.title, plt.xlabel, and plt.ylabel functions are utilized to add titles and labels to the plot.
The r before the string indicates a raw string, which allows us to include LaTeX syntax without needing to escape backslashes. This method makes it easy to incorporate complex mathematical symbols and equations directly into your plots.
Customizing LaTeX Rendering
Matplotlib provides options to customize how LaTeX is rendered in your plots. You can modify parameters such as font size, font family, and more. This customization is particularly useful when you want your plots to match the style of your documents or presentations. Below is an example of how to customize LaTeX rendering in Matplotlib.
import matplotlib.pyplot as plt
import numpy as np

plt.rc('text', usetex=True)
plt.rc('font', family='serif')

x = np.linspace(0, 10, 100)
y1 = np.sin(x)
y2 = np.cos(x)

plt.plot(x, y1, label=r'$\sin(x)$', color='blue')
plt.plot(x, y2, label=r'$\cos(x)$', color='red')
plt.title(r'$\sin$ and $\cos$ Functions', fontsize=16)
plt.xlabel(r'$x$ values', fontsize=14)
plt.ylabel(r'$y$ values', fontsize=14)
plt.legend()
plt.grid()
plt.show()
In this example, we set the usetex parameter to True, which tells Matplotlib to use LaTeX for text rendering. The plt.rc function is used to customize the font family to ‘serif’. We plot both the sine and cosine functions, using labels that include LaTeX syntax. The legend, titles, and labels are all rendered using LaTeX, resulting in a polished and professional look. By customizing these settings, you can ensure that your plots align with your specific aesthetic or publication requirements.
Adding Annotations with LaTeX
Annotations can significantly enhance the clarity of your plots, especially when you want to point out specific features or data points. Matplotlib allows you to add annotations using LaTeX, making it easier to convey complex mathematical ideas. Below is an example of how to add annotations with LaTeX in your plots.
import matplotlib.pyplot as plt
import numpy as np

x = np.linspace(0, 10, 100)
y = np.sin(x)

plt.plot(x, y)
plt.title(r'$\sin(x)$ Function', fontsize=14)
plt.xlabel(r'$x$ values', fontsize=12)
plt.ylabel(r'$\sin(x)$ values', fontsize=12)

plt.annotate(r'Max Value: $1$', xy=(1.57, 1), xytext=(2, 0.5),
             arrowprops=dict(facecolor='black', shrink=0.05))

plt.grid()
plt.show()
In this example, we use the plt.annotate function to add a note about the maximum value of the sine function. The xy parameter specifies the location of the annotation, while xytext specifies where the text should appear. The arrowprops argument allows us to customize the appearance of the arrow pointing to the annotation. By using LaTeX in the annotation text, we maintain a consistent style throughout our plot, making it easier for viewers to understand the significance of the highlighted data point.
Conclusion
Incorporating LaTeX formulas into your Matplotlib visualizations can significantly enhance the quality and clarity of your plots. By following the methods outlined in this tutorial, you can create professional-looking graphs that effectively communicate complex mathematical ideas. Whether you’re labeling axes, adding titles, or annotating specific points, LaTeX provides a robust solution for rendering mathematical text. As you become more comfortable with these techniques, you will find that your visualizations not only look better but also convey your message more effectively.
FAQ
-
How do I enable LaTeX rendering in Matplotlib?
You can enable LaTeX rendering by settingplt.rc('text', usetex=True)in your code. -
Can I customize the font used in LaTeX-rendered text?
Yes, you can customize the font by usingplt.rc('font', family='your_font_family'). -
Are there any limitations to using LaTeX in Matplotlib?
Some LaTeX packages may not be supported, and complex LaTeX commands may require additional configuration. -
How do I add LaTeX annotations to my plots?
You can add annotations using theplt.annotatefunction and include LaTeX syntax in the text. -
Can I use LaTeX for mathematical symbols only?
No, you can use LaTeX for a variety of text formatting options, including symbols, fonts, and styles.

Suraj Joshi is a backend software engineer at Matrice.ai.
LinkedIn