How to Create a Surface Plot in Matplotlib
- Setting Up Your Environment
- Preparing Your Data
- Creating the Surface Plot
- Customizing Your Surface Plot
- Conclusion
- FAQ
Creating visualizations is an essential part of data analysis, and surface plots are particularly effective for representing three-dimensional data. If you’re using Python, Matplotlib is a powerful library that allows you to create stunning surface plots effortlessly. By utilizing the plot_surface() method, you can generate visually appealing representations of your data, making it easier to identify trends and patterns. In this article, we will walk you through the steps to create a surface plot using Matplotlib, ensuring that you have all the tools you need to bring your data to life.
Whether you are a beginner or an experienced programmer, understanding how to create surface plots can significantly enhance your data visualization skills. In the following sections, we will explore the necessary steps, including setting up your environment, preparing your data, and finally creating a surface plot. So, let’s dive into the world of Matplotlib and discover how to create beautiful surface plots that can elevate your data presentations.
Setting Up Your Environment
Before you start creating surface plots, you need to ensure that you have the necessary libraries installed. Matplotlib is a fundamental library for plotting in Python, and NumPy is essential for handling numerical data. You can easily install both libraries using pip. Open your terminal or command prompt and run the following commands:
pip install matplotlib numpy
After successfully installing the libraries, you can start writing your Python script. Make sure to import the necessary libraries at the beginning of your script. Here’s how you can do that:
import numpy as np
import matplotlib.pyplot as plt
from mpl_toolkits.mplot3d import Axes3D
The numpy library is used for creating arrays and handling numerical operations, while matplotlib.pyplot is the primary plotting library. The mpl_toolkits.mplot3d module allows you to create 3D plots.
Once you have your environment set up, you are ready to prepare your data for the surface plot.
Preparing Your Data
Creating a surface plot requires a grid of data points. NumPy is perfect for this, as it allows you to create mesh grids easily. For demonstration purposes, let’s create a simple mathematical function to visualize.
Here’s how to prepare your data:
X = np.linspace(-5, 5, 100)
Y = np.linspace(-5, 5, 100)
X, Y = np.meshgrid(X, Y)
Z = np.sin(np.sqrt(X**2 + Y**2))
In this code snippet, we first generate linearly spaced values for both the X and Y axes using np.linspace(). We then create a mesh grid using np.meshgrid(), which gives us two 2D arrays representing the X and Y coordinates. Finally, we compute the Z values using a mathematical function, in this case, the sine of the square root of the sum of squares of X and Y.
These Z values will be the height of the surface plot at each (X, Y) coordinate. With the data prepared, we can now move on to creating the surface plot itself.
Creating the Surface Plot
Now that we have our data ready, it’s time to create the surface plot using the plot_surface() method. This method takes the X, Y, and Z data as input and generates a 3D surface plot. Here’s how to do it:
fig = plt.figure()
ax = fig.add_subplot(111, projection='3d')
ax.plot_surface(X, Y, Z, cmap='viridis')
plt.title('Surface Plot Example')
plt.xlabel('X-axis')
plt.ylabel('Y-axis')
ax.set_zlabel('Z-axis')
plt.show()
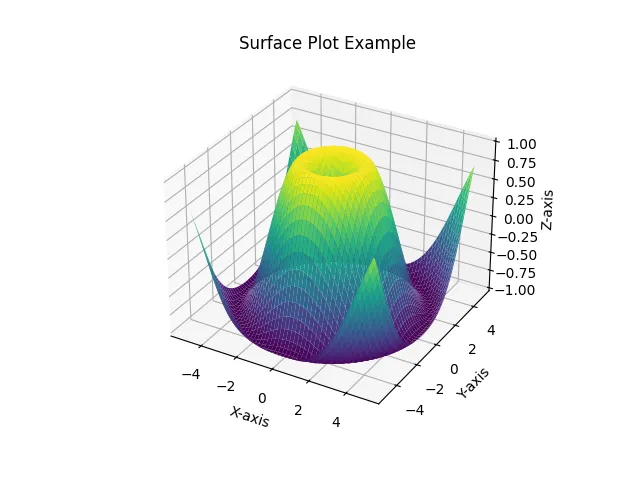
When you run this code, a window will pop up displaying the surface plot. The plot_surface() method takes several parameters, including the X, Y, and Z data, and the cmap parameter allows you to specify the colormap. In this example, we used the ‘viridis’ colormap, which is visually appealing and easy to interpret.
The plt.title() and plt.xlabel(), plt.ylabel(), and ax.set_zlabel() methods are used to add titles and labels to the axes, making the plot more informative. Finally, plt.show() displays the plot.
Output:
Creating surface plots with Matplotlib is straightforward and highly customizable. You can tweak various parameters, such as the colormap and mesh density, to suit your specific needs. Experimenting with different mathematical functions can also yield fascinating visualizations.
Customizing Your Surface Plot
Customization is key to making your surface plots more informative and visually appealing. Matplotlib offers a variety of options to enhance your plots. You can adjust the viewing angle, add color bars, and even change the lighting effects. Here’s an example of how to customize your surface plot further:
fig = plt.figure()
ax = fig.add_subplot(111, projection='3d')
surf = ax.plot_surface(X, Y, Z, cmap='plasma', edgecolor='none')
fig.colorbar(surf)
plt.title('Customized Surface Plot')
plt.xlabel('X-axis')
plt.ylabel('Y-axis')
ax.set_zlabel('Z-axis')
ax.view_init(elev=30, azim=30)
plt.show()
In this snippet, we changed the colormap to ‘plasma’ and removed the edges of the surface plot by setting edgecolor='none'. Additionally, we added a color bar using fig.colorbar(surf), which provides a reference for the color mapping in the plot. The ax.view_init() method allows you to set the elevation and azimuthal angles, giving you a different perspective on the surface.
Output:
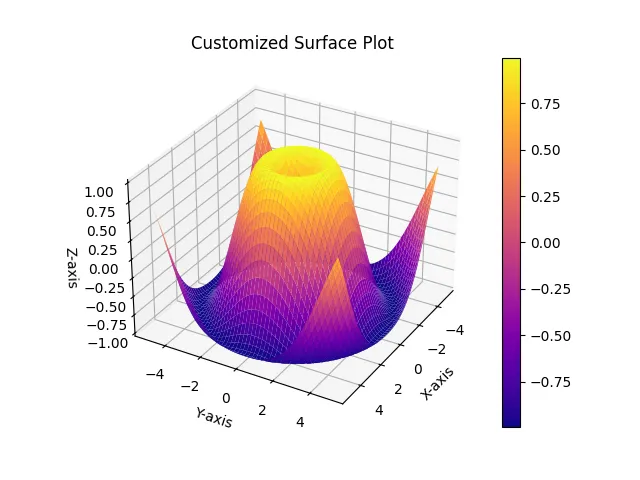
Customizing your surface plots can greatly enhance their clarity and impact. By playing with different visual styles and configurations, you can create plots that not only convey information effectively but also look stunning.
Conclusion
Creating surface plots in Matplotlib is a powerful way to visualize three-dimensional data. By using the plot_surface() method, you can easily generate plots that reveal trends and patterns in your data. With a few lines of code, you can set up your environment, prepare your data, and create stunning visualizations that can enhance your data analysis presentations.
Remember, the key to effective data visualization is not just in creating beautiful plots, but also in ensuring that they communicate the right information. So, don’t hesitate to experiment with different functions and customizations to make your surface plots uniquely yours.
FAQ
-
What is a surface plot?
A surface plot is a three-dimensional plot that displays data across a grid of points, showing how a dependent variable changes with two independent variables. -
How do I install Matplotlib and NumPy?
You can install Matplotlib and NumPy using pip with the commandspip install matplotlib numpy. -
Can I customize the colors in my surface plot?
Yes, you can customize the colors of your surface plot by using different colormaps available in Matplotlib, such as ‘viridis’, ‘plasma’, and more. -
How can I change the viewing angle of my surface plot?
You can change the viewing angle using theax.view_init()method, where you can specify elevation and azimuthal angles. -
What types of data are suitable for surface plots?
Surface plots are suitable for visualizing data that has three dimensions, such as mathematical functions or datasets with two independent variables and one dependent variable.

Suraj Joshi is a backend software engineer at Matrice.ai.
LinkedIn