How to Reset Color Order in MATLAB
- Create a Plot in MATLAB With Default Colors
- Create a Plot in MATLAB With Custom Color Order
- Reset the Color Order in MATLAB
- Conclusion

The color order in MATLAB plays a crucial role in setting the colors for figures and plots. While MATLAB provides default colors, you can customize these colors to match your data or presentation needs.
This tutorial will guide you through changing and resetting the color order in MATLAB.
Create a Plot in MATLAB With Default Colors
Color order refers to the sequence in which MATLAB assigns colors to different data series in your plots. By default, MATLAB uses a predefined color order, but it’s essential to know how to customize or reset it when necessary.
Before diving into resetting the color order, it’s essential to understand how MATLAB assigns default colors to plots. When you create a plot with multiple data series, MATLAB automatically assigns colors in a specific sequence to distinguish between them.
This default color order is often sufficient for basic visualization needs. Here’s an example to illustrate this concept:
% Create sample data
x = 1:10;
y1 = sin(x);
y2 = cos(x);

% Plot the data
plot(x, y1, 'o-', 'DisplayName', 'Sine');
hold on;
plot(x, y2, 's--', 'DisplayName', 'Cosine');
legend;
title('Default Color Order');
xlabel('X-axis');
ylabel('Y-axis');
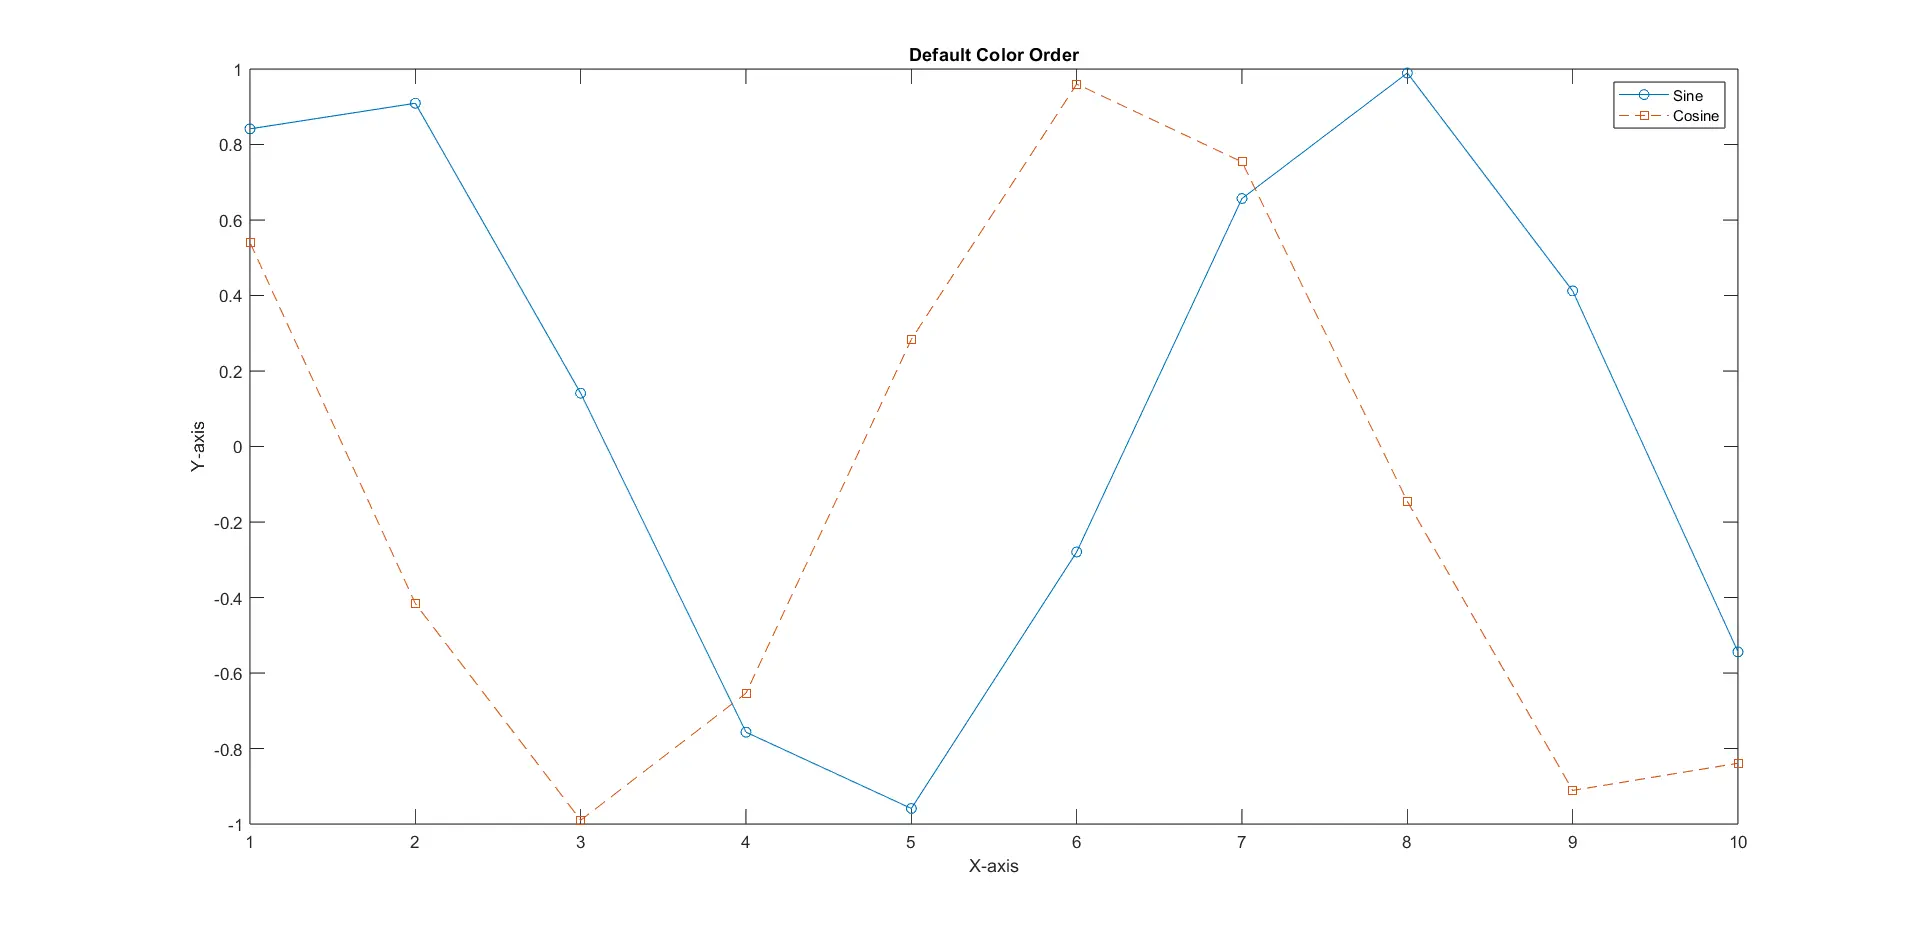
Here, we create a plot to visualize the sine and cosine functions using default colors and various plot customizations. It begins by defining sample data, with the x-values ranging from 1 to 10, and calculating the corresponding y-values for both sine and cosine functions.
The plot function is then used to create the plot. The first plot command generates a line plot with circular markers o- for the sine function, while the second plot command creates a line plot with square markers s-- for the cosine function.
The DisplayName property is set to Sine and Cosine for labeling in the legend. The hold on command ensures that subsequent plots overlay on the current one.
A legend is also added to display the labels Sine and Cosine for clarity. Additionally, the plot is given the title Default Color Order, and the x and y-axes are labeled with X-axis and Y-axis, respectively.
When executed, this code produces a visually informative plot that distinguishes the sine and cosine functions while providing context through labels and a title.
This code will generate a plot with the default color order, which typically includes a sequence of different colors for each data series.
Create a Plot in MATLAB With Custom Color Order
Sometimes, the default color order may not meet your visualization requirements. You might want to use specific colors to match your data or maintain consistency with a predefined color scheme.
To do this, you can define a custom color order using an RGB triplet or color name.
% Define custom color
customColors = [
    1 1 0;
    0 1 1;
    1 0 1;
    0.5 0.5 0.5
];

% Create sample data
x = 1:10;
y1 = sin(x);
y2 = cos(x);

% Set the custom color order
set(gca, 'ColorOrder', customColors);

% Plot the data
plot(x, y1, 'o-', 'DisplayName', 'Sine');
hold on;
plot(x, y2, 's--', 'DisplayName', 'Cosine');
legend;
title('Custom Color Order');
xlabel('X-axis');
ylabel('Y-axis');
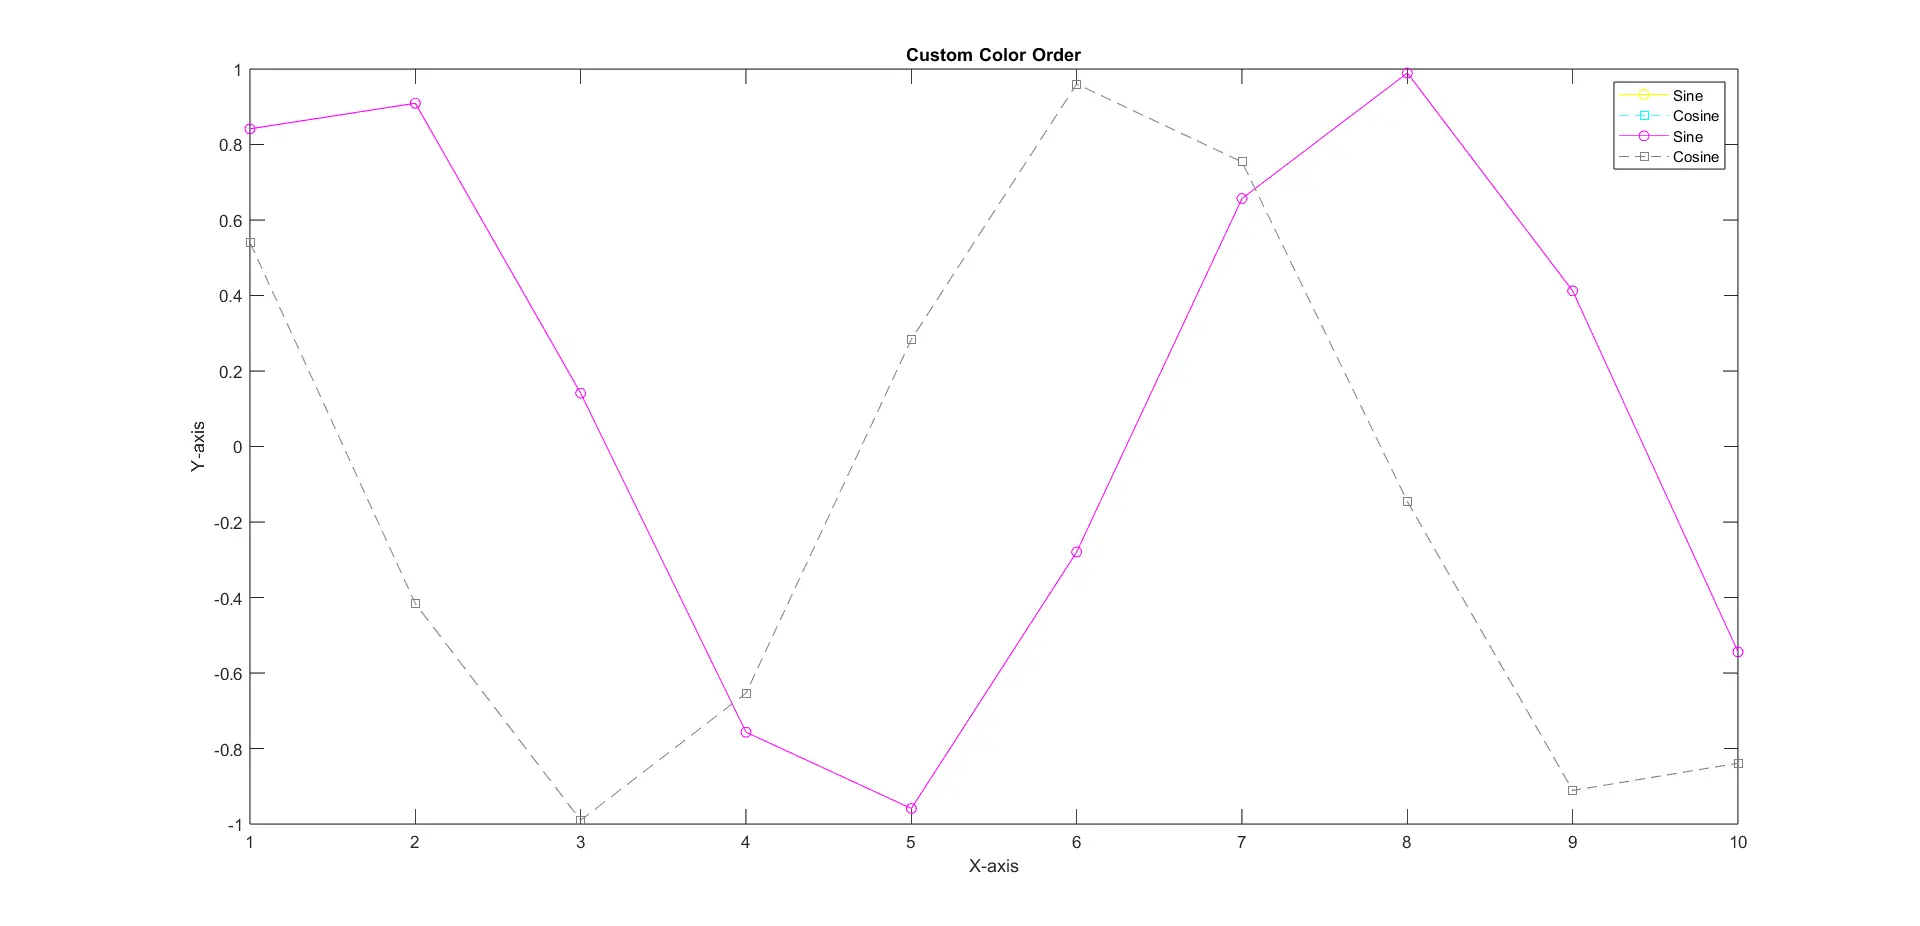
In this piece of MATLAB code, we’re customizing the color order for the previous plot to make it more visually appealing and informative. We start by defining a set of custom colors using RGB triplets. These triplets represent specific colors, such as yellow, cyan, magenta, and gray.
To apply our custom color order to the plot, we use the set function to specify the custom colors for the current axes (retrieved with gca). This ensures that the subsequent plots will use our defined custom colors.
When you run this code, you’ll get a plot with the custom color order, making it a visually appealing and informative representation of the data.
Reset the Color Order in MATLAB
Resetting the color order in MATLAB can be useful when you want to return to the default color sequence or change the color order for future plots. There are several methods to achieve this:
Using the set Function
One effective way to reset the color order for the current axes is by utilizing the 'ColorOrderIndex' property along with the set function. This method allows you to reset the color order to its initial state, beginning with the first color in the sequence.
Here’s how you can do it:
set(gca, 'ColorOrderIndex', 1);
In the code snippet above, gca is a MATLAB function that retrieves the current axes, and we are setting the 'ColorOrderIndex' property to 1. This simple line of code resets the color order, ensuring that the next plot you create will start using the first color from the color sequence.
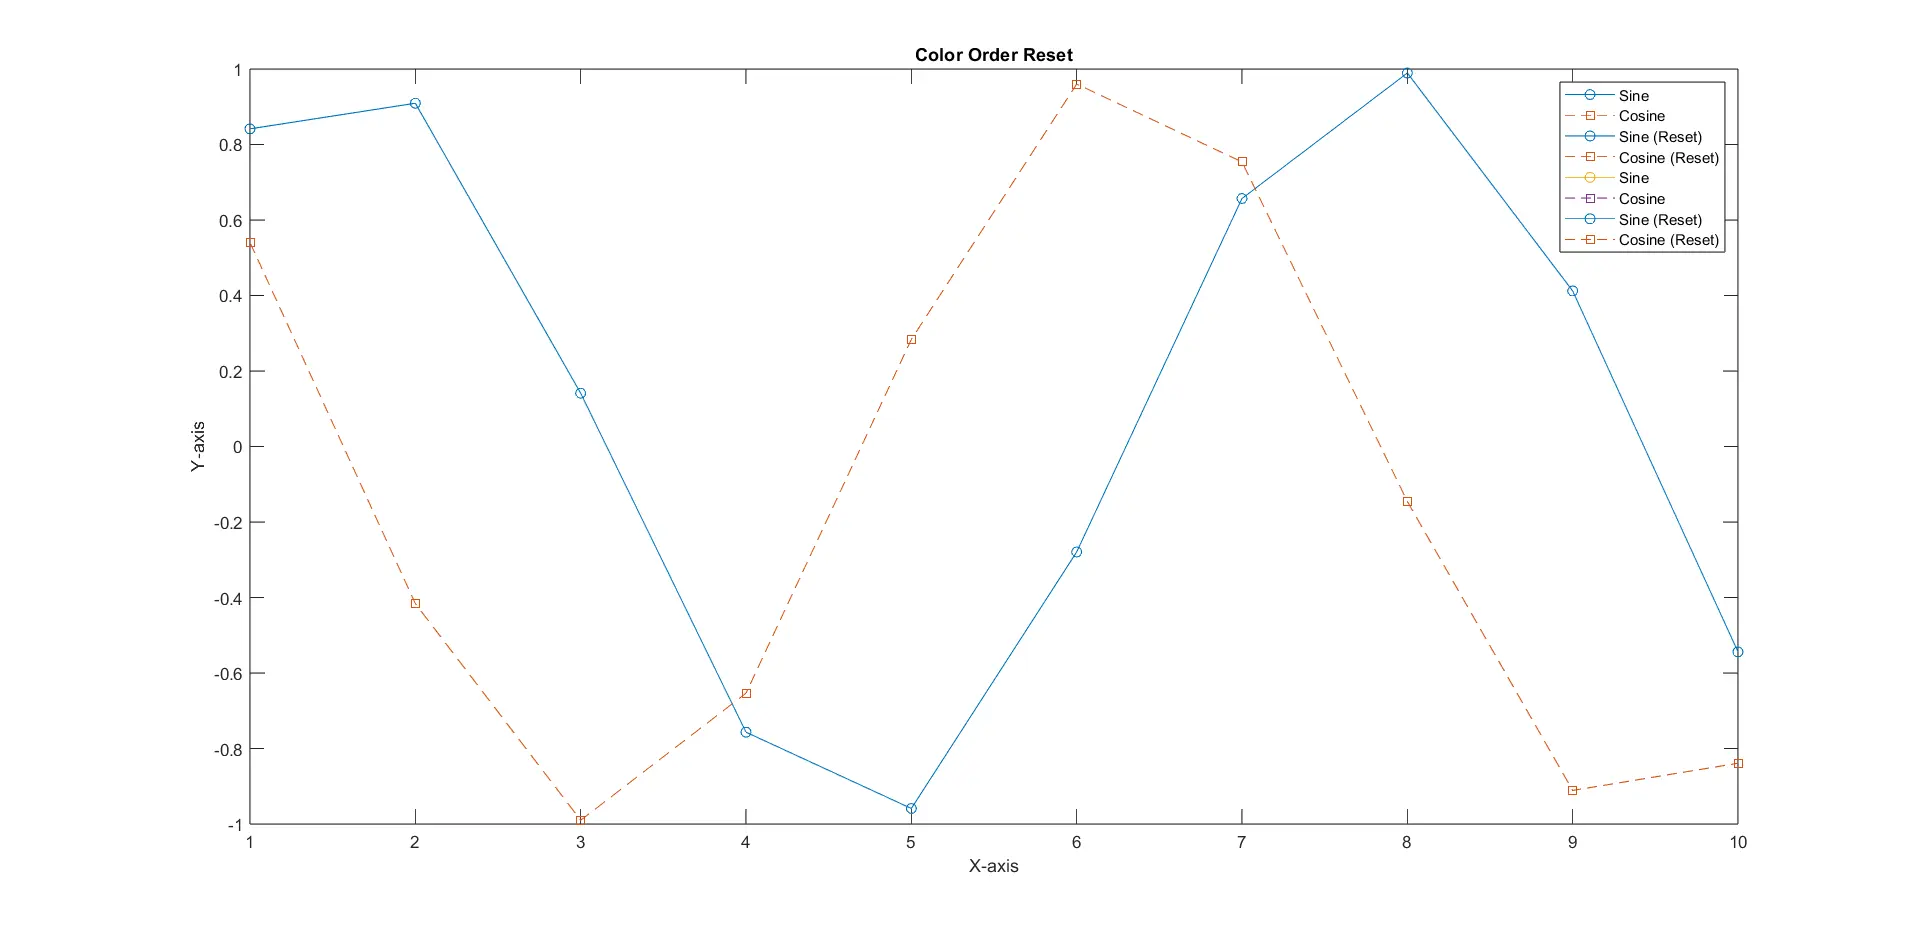
As seen in the example above, we initially set custom colors for the plot. Now, if you wish to return to the default color sequence or change the color order for future plots, you can use the set function with 'ColorOrderIndex' as shown earlier.
After you run it, the color order will be reset, and the next plots you create on the same axes will once again use the default color sequence.
Below is the final output of the plot after resetting the color order:
Changing the ColorOrder Property
An alternative yet equally effective way to reset the color order for your plots is by modifying the 'ColorOrder' property of the current axes. This approach is akin to the previous method that uses the 'ColorOrderIndex,' and it can be particularly useful when you want to return to the default color sequence for your visualizations.
Here’s how you can implement this technique:
ax = gca;  % Get the current axes
ax.ColorOrderIndex = 1;
In this code snippet, gca is a built-in MATLAB function that retrieves the current axes, and we are resetting the color order by setting the 'ColorOrderIndex' to 1. This action effectively reverts the color order to the initial state, starting with the first color in the sequence.
Once executed, this code resets the color order, ensuring that any subsequent plots on the same axes will utilize the default color sequence.
Below is the final output of the plot after resetting the color order using the 'ColorOrder' property:

Conclusion
In conclusion, MATLAB provides various methods to reset and customize the color order for your plots. Whether you need to return to the default color sequence or define your custom colors, these methods allow you to tailor your visualizations to your specific needs, ensuring that your data is presented as you intend.
Try to experiment with these techniques to create visually appealing and informative plots in MATLAB.

Sheeraz is a Doctorate fellow in Computer Science at Northwestern Polytechnical University, Xian, China. He has 7 years of Software Development experience in AI, Web, Database, and Desktop technologies. He writes tutorials in Java, PHP, Python, GoLang, R, etc., to help beginners learn the field of Computer Science.
LinkedIn Facebook