MATLAB에서 색상 순서 재설정

이 자습서에서는 MATLAB에서 색상 순서를 재설정하는 방법을 보여줍니다.
MATLAB에서 색상 순서 재설정
색상 순서는 MATLAB에서 그림 또는 플롯의 색상을 설정하는 데 사용됩니다. 그림이나 플롯이 존재하지 않는 경우 MATLAB은 그림을 만들고 색상을 설정합니다.
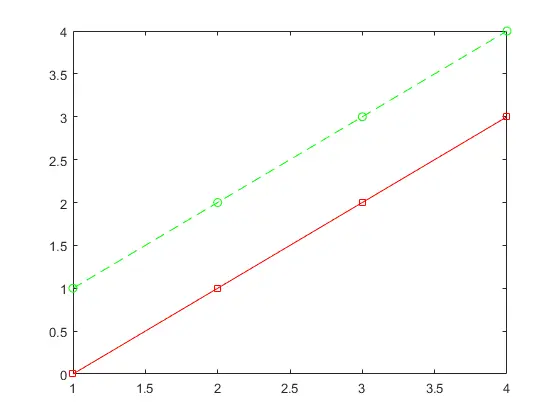
플롯 함수를 호출할 때 또는 플롯 함수를 호출한 후에도 색상을 사용자 정의할 수 있습니다. 다음은 기본 색상을 사용한 MATLAB 플롯의 예입니다.
plot1 = plot([0 1 2 3],'-r');
hold on
plot2 = plot([1 2 3 4],'--g');
hold off

% Add markers to the plot
plot1.Marker = 'sq';
plot2.Marker = 'o';
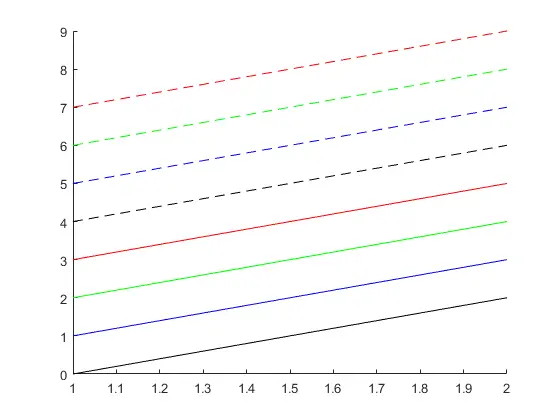
이제 플롯에서 색상을 변경하는 방법을 살펴보겠습니다. 예를 참조하십시오:
demoaxes = axes;
demoaxes.ColorOrder = [ 0 0 0; 0 0 1; 0 1 0; 1 0 0];
demoaxes.LineStyleOrder = {'-','--'};
hold on
for a = 0:7
    plot([a a+2])
end
hold off
위의 코드는 플롯에 ColorOrder 및 LineStyleOrder를 할당합니다. 출력 참조:
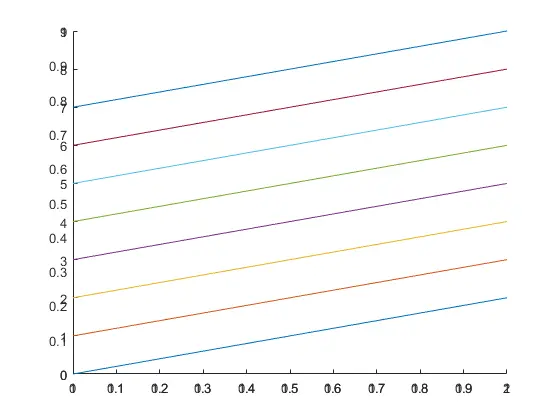
MATLAB에서 색상 순서를 재설정하려면 set 메서드를 사용하고 ColorOrderIndex를 1로 설정하면 그림 또는 플롯의 ColorOrder가 재설정됩니다. 위의 예에서 ColorOrder를 재설정해 보겠습니다.
demoaxes = axes;
demoaxes.ColorOrder = [ 0 0 0; 0 0 1; 0 1 0; 1 0 0];
demoaxes.LineStyleOrder = {'-','--'};
%Reset Color Order
set(axes,'ColorOrderIndex',1)
hold on
for a = 0:7
    plot([a a+2])
end
hold off
주어진 플롯에 대해 ColorOrder가 재설정됩니다. 출력을 참조하십시오.

Sheeraz is a Doctorate fellow in Computer Science at Northwestern Polytechnical University, Xian, China. He has 7 years of Software Development experience in AI, Web, Database, and Desktop technologies. He writes tutorials in Java, PHP, Python, GoLang, R, etc., to help beginners learn the field of Computer Science.
LinkedIn Facebook