How to Capture and Analyze Java Heap Dump

Mehvish Ashiq Feb 15, 2024
  1. Introduction to Heap Dump and Its Formats
  2. Example Code Causing OutOfMemoryError in Java
  3. Different Ways to Capture Heap Dump
  4. Analyze Java Heap Dump
How to Capture and Analyze Java Heap Dump

Heap dumps contain a snapshot of all live objects the running Java application uses on a Java heap. This tutorial educates about heap dump, its various formats, and its importance.

Further, we will go through an example demonstrating OutOfMemoryError, which will lead to various approaches to capture heap dump and a tool to analyze it.

Introduction to Heap Dump and Its Formats

A heap contains all the objects that we create by instantiating a class. Every class of Java runtime is also created in this heap.

This heap is created when JVM (Java Virtual Machine) starts and can expand/shrink during runtime to adjust objects destroyed or created in an application.

The garbage collection process runs whenever a heap gets full, this process collects all the objects that are no longer used, or we can say not referenced anymore (you can find more on memory manage here. Usually, heap dumps are stored in the binary format hprof files.

We can retrieve detailed information about each object instance like type, class name, address, size and whether an instance contains references to another object(s) or not. The heap dumps can be in one of the following two formats:

  1. The Portable Heap Dump Format (also known as PHD format)
  2. The Classic Format

Remember that the portable heap dump is the default format and is in binary which must be processed for further analysis. On the other hand, the classic format is in ASCII text which is human-readable.

You may read about these two formats here.

Importance of Using Heap Dump

Usually, we get the advantage of heap dump when an application is crashed due to OutOfMemoryError or a Java application consuming more memory than expected.

Heap dump helps us to identify the primary causes for the error and other details, for instance, the number of objects in every class, memory usage for every class, etc.

It also assists in capturing the memory size occupied by each Java object of an application. All this captured information can be useful for finding an actual code causing memory leak issues.

Let’s look at a code example causing OutOfMemoryError, which will lead to various ways to capture Java heap dump.

Example Code Causing OutOfMemoryError in Java

import java.util.ArrayList;
import java.util.List;

public class Test {
  public static void main(String[] args) {
    List<byte[]> myList = new ArrayList<>();
    int index = 0;

    while (true) {
      // 1MB each iteration, 1 x 1024 x 1024 = 1048576
      byte[] bytes = new byte[1048576];
      myList.add(bytes);
      Runtime runTime = Runtime.getRuntime();
      System.out.printf("[%d] free memory is: %s%n", index++, runTime.freeMemory());
    }
  }
}

The above code will keep allocating memory by executing the while loop until a specific point is reached where Java Virtual Machine cannot allocate enough memory.

At that point, we will get java.lang.OutOfMemoryError: Java heap space error.

...
...
...
[1510] free memory is: 14687728
[1511] free memory is: 12590576
[1512] free memory is: 10493424
[1513] free memory is: 8396272
[1514] free memory is: 6299120
[1515] free memory is: 4201968
[1516] free memory is: 2104320
Exception in thread "main" java.lang.OutOfMemoryError: Java heap space
        at Test.main(Test.java:16)

This is where we need to do heap dump analysis to find the reasons causing OutOfMemoryError. It can be done in two steps.

First, capture the heap dump and then analyze the heap dump file to find the suspected reasons.

Different Ways to Capture Heap Dump

There are multiple ways to capture heap dump. Let’s learn the following one by one below.

  1. jmap
  2. JVisualVM
  3. jcmd
  4. Generate Heap Dump Automatically
  5. JMX

Use jmap to Capture Heap Dump

The jmap tool prints memory statistics in a running Java Virtual Machine (JVM); we can also use it for remote and local processes.

We use the -dump option to capture heap dump using the jmap tool, which we can use from the bin folder of JDK’s home directory.

Syntax:

jmap -dump:[live],format=b,file=<file-path> <pid>

Example:

C:\Program Files\Java\jdk-18\bin> jmap -dump:live,format=b,file=/temp/dump.hprof 12876

Following is a brief description of the options that we have specified above:

Parameter Description
live This parameter is optional; if it is set, it will only print objects having active references. It omits those which are ready to be garbage collected.
format=b It is used to specify the format in which the dump file will be saved. Here, we used b, meaning this dump file would be in binary format. The result will be the same if this parameter is not set.
file It is the file to which the dump will be written.
pid It denotes an id of the Java process.

Note that we can use the jps command to get pid. Additionally, jmap was introduced as an experimental tool in JDK, and it is unsupported; therefore, in some situations, you may have to go for other tools instead of using jmap.

Use JVisualVM to Capture Heap Dump

The JVisualVM is a graphical user interface that allows us to keep track of profiling Java applications and troubleshooting. It is simple, easy to use and lets us capture a heap dump.

According to this, it was available with Oracle JDK 6, 7, and 8. As of JDK 9 or later, JVisualVM is no longer provided with Oracle JDK; the users have to download it separately if they want to use it.

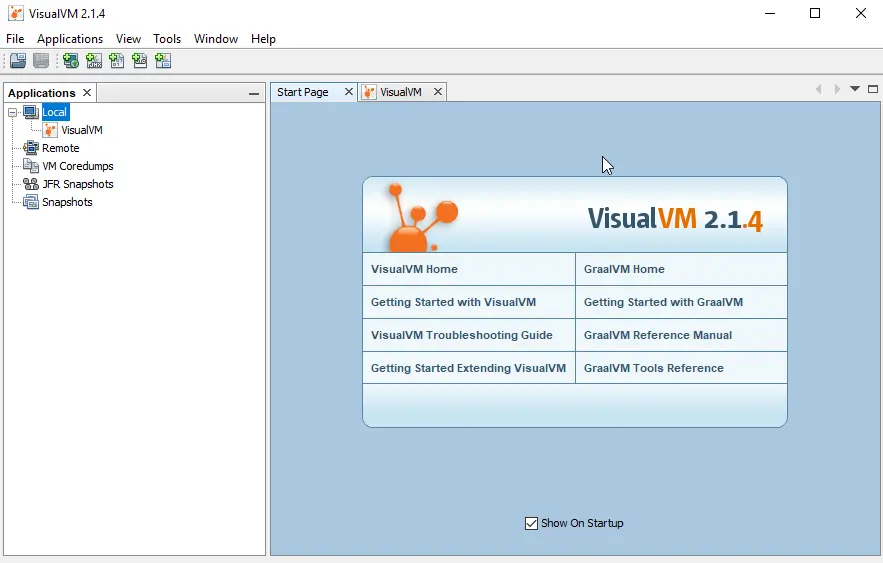
Let’s download it from visualvm.github.io, extract the .zip file, locate visualvm.exe in the bin folder, double-click on it, hit the I Accept button when prompt, and you will see the following screen.

capture and analyze java heap dump - visualvm startup window

All the Java processes that are currently running will be listed under Local. We can capture a heap dump by selecting the desired Java process, right-clicking on it, and choosing the Heap Dump option.

It will open a new tab demonstrating all the necessary information.

Use jcmd to Capture Heap Dump

This tool can also be found in the bin folder of JDK’s home directory; in our case, it is C:\Program Files\Java\jdk-18\bin. Yours might be different if you have not installed Java on the default location.

The jcmd sends command requests to a Java Virtual Machine. Remember that we have to use it on the same machine running a Java process.

It has multiple commands, one of them is GC.heap-dump, which we will use to capture a heap dump by specifying the process id (pid) and a path for an output file. See the syntax of the jcmd command below.

Syntax:

jcmd <pid> GC.head_dump <file-path>

Example:

C:\Program Files\Java\jdk-18\bin> jcmd 12876 GC.head_dump /temp/dump.hprof

Like jmap, it will also generate the dump in binary format.

Capture Heap Dump Automatically

All the approaches we have learned capture heap dump manually at a particular time, but in some circumstances, we have to generate heap dump as soon as java.lang.OutOfMemoryError occurs.

Here, automatically generating a heap dump will help us investigate an error.

Considering these scenarios, Java serves with HeapDumpOnOutOfMemoryError , a command line option that can generate a heap dump when an application throws java.lang.OutOfMemoryError.

java -XX:+HeapDumpOnOutOfMemoryError

By default, the above command will store the dump in the java_pid<pid>.hprof file located where our application is running. We can specify a custom directory or file and set it in a HeapDumpPath option.

Syntax:

java -XX:+HeapDumpOnOutOfMemoryError  -XX:HeapDumpPath=<file-or-dir-path>

Example:

java -XX:+HeapDumpOnOutOfMemoryError  -XX:HeapDumpPath=/temp/heapdump.bin

Now, we can locate the created file containing heap dump in logs as follows whenever our application runs out of memory via this option.

java.lang.OutOfMemoryError: Requested array size exceeds VM limit
During heap to java_pid12876.hprof...
  Exception in thread "main" Head dump file created [4745371 bytes in 0.028 secs]
  java.lang.OutOfMemoryError: Requested array size exceeds VM limit

We can see that the above text is written to the java_pid12876.hprof file, and there is no overhead while running our application using this option.

It is good to use this option for all applications, particularly in production, because you will never know when OutOfMemoryError will occur.

Remember that we can use this option at runtime using HotSpotDiagnostic MBean. For that, JConsole is used and set HeapDumpOnOutOfMemoryError VM option to true.

Use JMX to Capture Heap Dump

In this method, we will be using HotSpotDiagnostic MBean, which provides a dumpHeap method accepting the following two parameters:

Parameter Description
outputFile It is a path of an output file for dump; this file must have a .hprof extension to hold dump.
live If we set it to true, it will only dump the active objects in memory, as we learned while using jmap in this tutorial.

We can invoke it in two ways to capture a heap dump, invoke it programmatically or use the JMX client like JConsole located in the bin folder of JDK’s home directory. We will be using JMX here, but you can learn how to invoke it programmatically here.

Using HotSpotDiagnostic MBean via the JMX client (JConsole) is the easiest way to open JConsole, connect to the running Java process, navigate to the MBeans tab, and look for HotSpotDiagnostic under com.sun.management.

We can find the dumpHeap method under the Operations dropdown, where we can specify outputFile and live parameters into p0 and p1 text fields to perform the dumpHeap operation as demonstrated below.

capture and analyze java heap dump - mbeans

Now, it’s time to analyze the Java heap dump.

Analyze Java Heap Dump

In Java heap dump, we need to look for objects using high memory, objects graph to find objects that are not releasing memory, and reachable & unreachable objects.

The Eclipse Memory Analyzer (MAT) is best for analyzing the Java heap dump that we generated earlier. We will start Memory Analyzer Tool and open a heap dump file to do that.

In Eclipse Memory Analyzer (MAT), we will have two kinds of object sizes that are briefly explained below.

  1. Shallow Heap Size - An object’s shallow heap is its size in memory.
  2. Retained Heap Size - It is an amount of memory that will be freed once an object is garbage collected.

Once the heap dump file is opened, we can see a summary of the memory usage of an application. Now, we can easily figure out what is causing OutOfMemoryError.

Mehvish Ashiq avatar Mehvish Ashiq avatar

Mehvish Ashiq is a former Java Programmer and a Data Science enthusiast who leverages her expertise to help others to learn and grow by creating interesting, useful, and reader-friendly content in Computer Programming, Data Science, and Technology.

LinkedIn GitHub Facebook

Related Article - Java Heap