How to Make a Pie Chart in AngularJS
This article will introduce the pie chart in AngularJS and how it works, with an example.
Make a Pie Chart in AngularJS
We may have to use or display charts in our application to showcase the data in many situations. For this purpose, AngularJS provides us with some libraries that can be used, which we will discuss in detail.
The chart library is an AngularJS version of the JavaScript chart.js library. An AngularJS chart is an HTML5-based charting library that makes a chart on canvas HTML5 element.
AngularJS chart is the lightweight and famous charting library in JavaScript. The main highlights of angular_chart.js are responsive, reactive, and HTML5-supported chart library.
We can make attractive charts for AngularJS by applying the chart.js library. An AngularJS chart is a native angular directive for Chart.js.
These are the following demanded dependencies:
- AngularJS (tested with 1.2.x, 1.3.x, and 1.4.x, although it probably works with previous versions)
Chart.js(requiresChart.js1.0, examined with version 1.0.1 and 1.0.2)
Now, we can explain the pie chart in Angular with the help of an example.
Let’s create a new AngularJS application to go through an example of directives. First, we will add the AngularJS library using the script tags.
# AngularJs
<script src="https://ajax.googleapis.com/ajax/libs/angularjs/1.3.16/angular.min.js"></script>
Now we will define the AngularJS application using ng-app.
# AngularJs
<body ng-app="">
   ...
</body>
First of all, we will include all dependency files of AngularJS charts.
# Angular

<script src="/angular/angular.min.js"></script>
  <script src="/Chart.js/Chart.min.js"></script>
  <script src="/angular-chart.js/dist/angular-chart.min.js"></script>
   <link rel="stylesheet" href="/angular-chart.js/dist/angular-chart.css">
Now, we will inject the dependency into the AngularJS module.
# Angular

angular.module("ngApp", ["chart.js"])
Now, we will define the data and labels for the pie charts. We must assign all labels in the ChartLabels array and data into the ChartData JavaScript array.
And make sure the labels and data series will not conflict.
# Angular
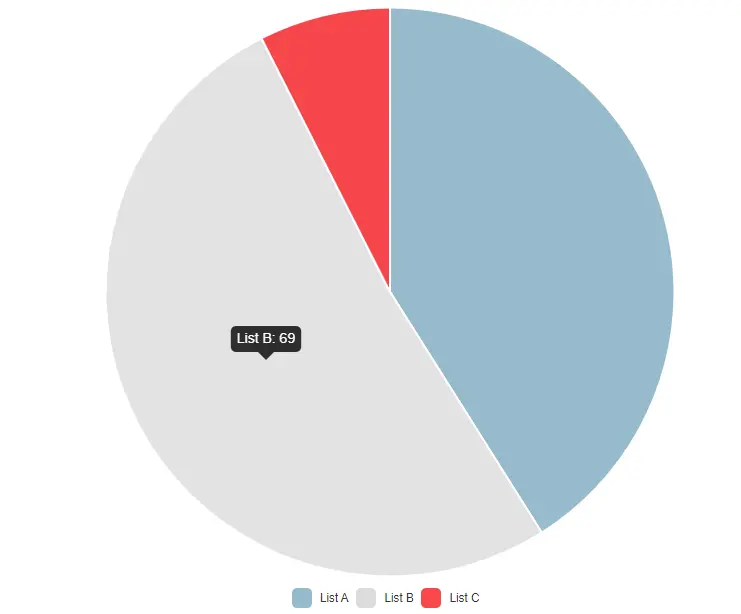
$scope.chartLabels = ['List A', 'List B', 'List C'];
$scope.chart-data = [55, 69, 10];
We will now define the Chart directory in the HTML file and assign the model to it.
# Angular

<canvas id="pie" class="chart chart-pie" chart-data="chart-data" chart-labels="labels" legend="true">
</canvas>
Sometimes we need to perform some operation on click of a pie chart slice, so the below code will help get clicked slice value of a pie chart.
# Angular

chart-click="onClickdisplay"
$scope.onClickdisplay = function (points, evt) {
          console.log(points);
        };
Output:
As we can see from the above example, we can easily create a pie chart using the chart.js library.

Rana is a computer science graduate passionate about helping people to build and diagnose scalable web application problems and problems developers face across the full-stack.
LinkedIn