HOWTO · Matplotlib
twinx et twiny en Matplotlib
Ce tutoriel explique comment créer des axes jumeaux dans Matplotlib avec un axe X ou un axe Y commun en utilisant matplotlib.axes.Axes.twinx() et matplotlib.axes.Axes.twiny() en Python.
Sur cette page
Ce tutoriel explique comment créer des axes jumeaux dans Matplotlib avec un axe X ou un axe Y commun en utilisant matplotlib.axes.Axes.twinx() et matplotlib.axes.Axes.twiny() en Python.
matplotlib.axes.Axes.twinx() en Python Matplotlib
La fonction matplotlib.axes.Axes.twinx() crée d’autres axes dans une figure Matplotlib partageant le axe X commun avec les axes initiaux.
import matplotlib.pyplot as plt

students = ["Anil", "Sohit", "Hrishav", "Ayush", "Sunil"]
heights_in_cms = [165, 160, 140, 150, 130]

fig, axes = plt.subplots()
fig.set_size_inches(8, 6)
axes.bar(students, heights_in_cms)
y1, y2 = axes.get_ylim()
axes.set_xlabel("Students", fontsize=12)
axes.set_ylabel("Height in cms", fontsize=12)

twin_axes = axes.twinx()
twin_axes.set_ylim(y1 * 0.394, y2 * 0.394)
twin_axes.set_ylabel("Height in Inches", fontsize=12)

fig.suptitle("Plot using matplotlib.axes.Axes.twinx()", fontsize=15)
plt.show()
Production :
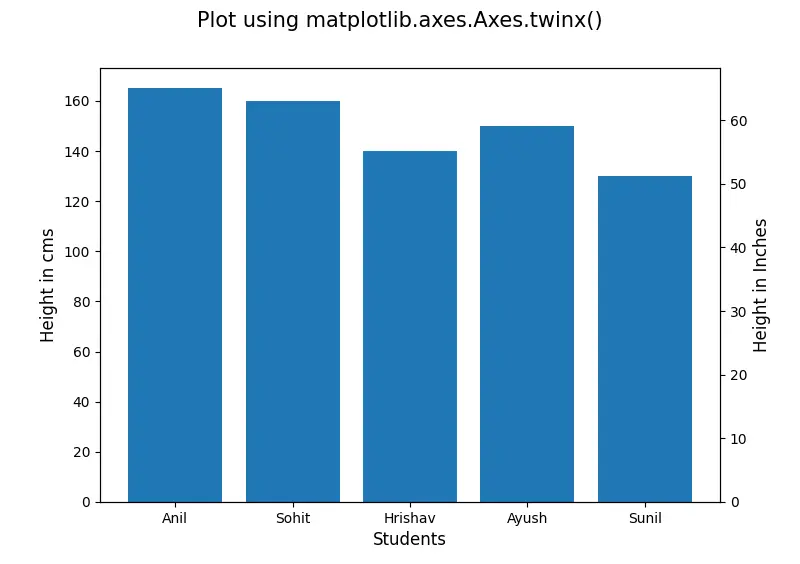
Il crée un histogramme de la taille des élèves. Les étiquettes de l’axe Y à gauche représentent la hauteur des élèves en cm, tandis que les étiquettes de l’axe Y à droite représentent la hauteur des élèves en inches.
Dans ce cas, nous créons un nouvel axe, twin_axes, qui partage l’axe X avec les axes. L’axe Y des axes a son étiquette définie à Height in cms, tandis que l’axe Y des twin_axes est défini à Height in Inches.
matplotlib.axes.Axes.twiny() en Python Matplotlib
La fonction matplotlib.axes.Axes.twiny() crée d’autres axes dans une figure Matplotlib partageant l’axe Y commun avec les axes initiaux.
import matplotlib.pyplot as plt

distance_in_kms = [10, 20, 30, 40, 50]
fare_in_dollars = [2, 3.5, 5, 7, 10]

fig, axes = plt.subplots()
fig.set_size_inches(10, 8)
axes.plot(distance_in_kms, fare_in_dollars)
x1, x2 = axes.get_xlim()
axes.set_xlabel("Distance in kms", fontsize=12)
axes.set_ylabel("Fare ($)", fontsize=12)

twin_axes = axes.twiny()
twin_axes.set_xlim(x1 * 0.62, x2 * 0.62)
twin_axes.set_xlabel("Distance in miles", fontsize=12)

fig.suptitle("Plot using matplotlib.axes.Axes.twiny()", fontsize=15)
plt.show()
Production :
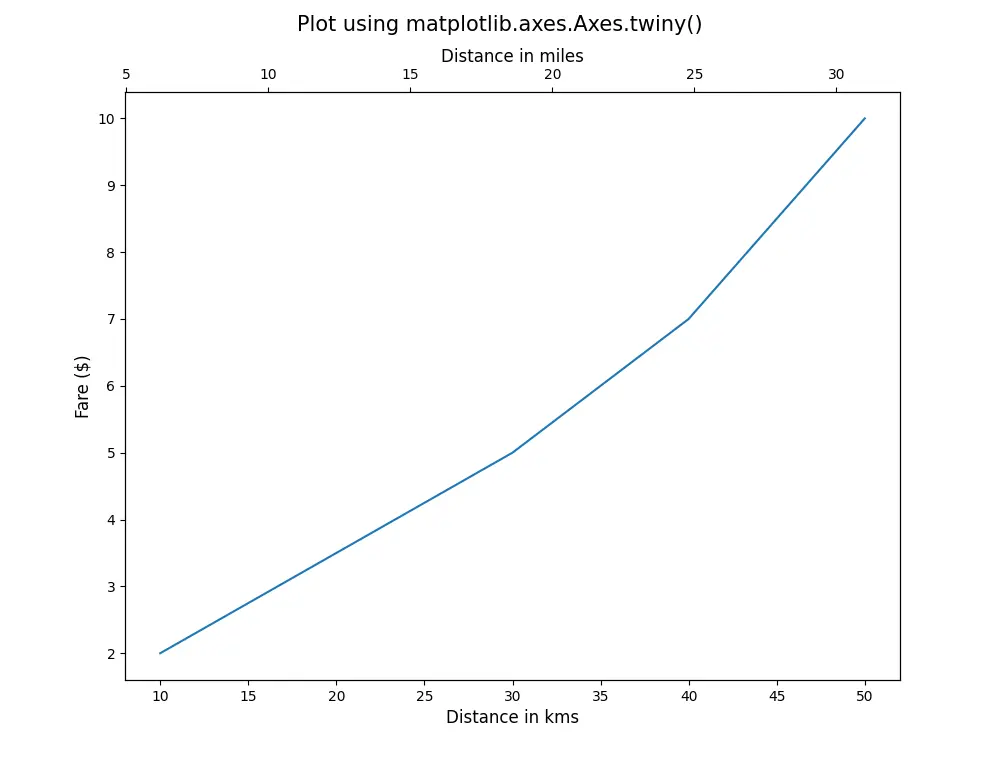
Nous créons un nouvel axe, twin_axes, qui partage l’axe Y avec les axes. L’axe X des axes a son label défini à Distance en kms tandis que l’axe X des twin_axes est défini à Distance en miles.
Matplotlib Utilisez twinx() et twiny() ensemble
import matplotlib.pyplot as plt

distance_in_kms = [10, 20, 30, 40, 50]
fare_in_dollars = [2, 3.5, 5, 7, 10]

fig, axes = plt.subplots()
fig.set_size_inches(10, 8)
axes.plot(distance_in_kms, fare_in_dollars)
x1, x2 = axes.get_xlim()
y1, y2 = axes.get_ylim()
axes.set_xlabel("Distance in kms", fontsize=12)
axes.set_ylabel("Fare ($)", fontsize=12)

twin_axes = axes.twinx().twiny()

twin_axes.set_ylim(y1 * 0.85, y2 * 0.85)
twin_axes.set_ylabel("Fare in Euros", fontsize=12)

twin_axes.set_xlim(x1 * 0.62, x2 * 0.62)
twin_axes.set_xlabel("Distance in miles", fontsize=12)

fig.suptitle("Matplotlib use twinx() and twiny() together", fontsize=15)
plt.show()
Production :
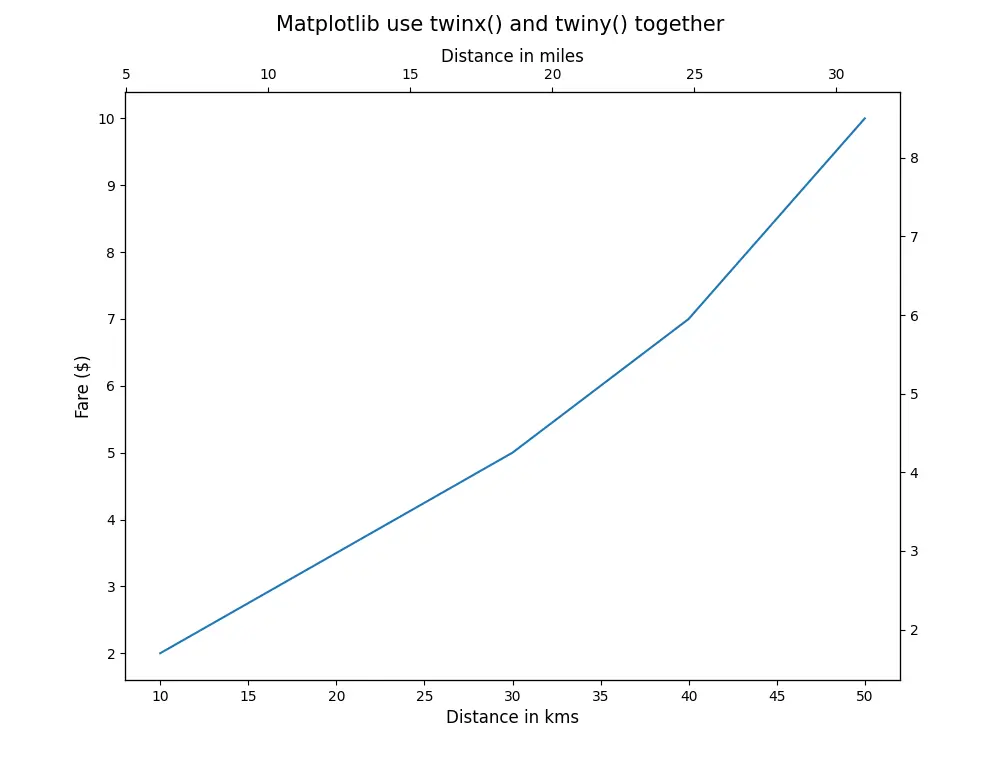
Il crée une figure de Matplotlib avec des marques de tique sur tous les côtés de la figure. Les axes contrôlent l’axe X gauche et l’axe Y inférieur, tandis que les twin_axes contrôlent l’axe X droit et l’axe Y supérieur.