将透明矩形添加到 R 中的 Boxplot
本文将演示有关如何在 R 中向箱线图添加透明矩形的多种方法。
使用 rect 函数将透明矩形添加到 R 中的箱线图
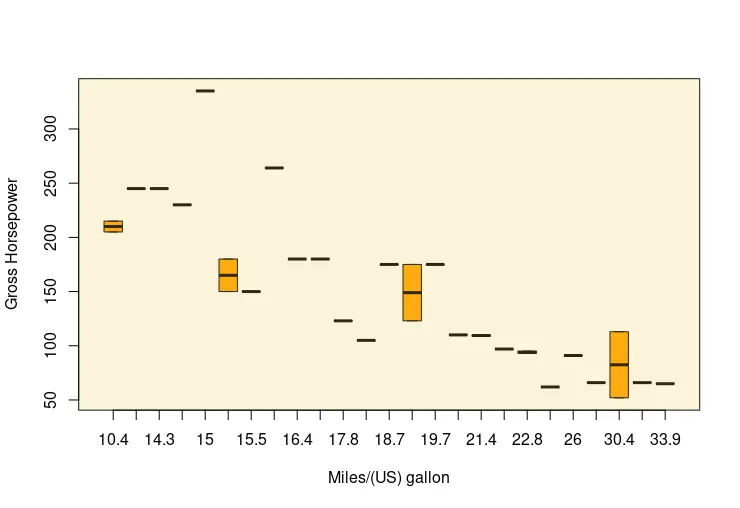
可以绘制一个透明矩形作为现有图形的叠加,使用 boxplot 函数构建。rect 函数在 plot 函数之后调用以绘制矩形。请注意,rect 也可用于绘制具有给定坐标的矩形序列。在这种情况下,我们只向作为背景叠加的箱线图中添加一个矩形。rect 函数将位置作为前四个参数,用于指定矩形区域。这四个参数可以作为标量值或标量向量传递。以下示例采用 mtcars 数据集及其两个数字列来绘制比例尺。由于这些值是数字,我们可以使用 max 函数来指定一些位置。rect 函数还可以将颜色作为参数来填充矩形。这一次,rgb 函数用于传递颜色值和代表其不透明度的 alpha 参数。
boxplot(hp ~ mpg, data = mtcars,
       xlab = "Miles/(US) gallon", ylab = "Gross Horsepower",
       col = "orange")

rect(-1, -1, max(mtcars$hp + 100), max(mtcars$hp) + 100,
     col= rgb(red = 0.95, green = 0.8, blue = 0.3, alpha = 0.2))
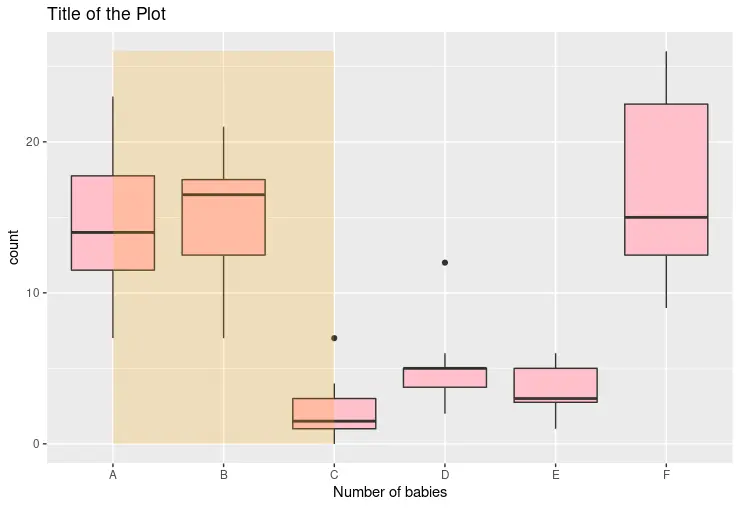
使用 annotate 函数和 ggplot 将透明矩形添加到 R 中的 Boxplot
如果绘图是使用 ggplot 库构建的,我们可以使用 annotate 函数添加一个透明矩形。以下代码片段在 x 轴上显示带有字符值的箱线图。annotate 函数将 rect 字符串作为第一个参数来指定注释层的矩形形状。以下四个参数指定形状的位置值。即使 x 轴具有非数字值,该函数也可以枚举它们的位置并拟合用户传递的位置编号。
library(ggplot2)
library(dplyr)

p1 <- ggplot(InsectSprays, aes(x = spray, y = count)) +
  geom_boxplot(fill = "pink") +
  scale_x_discrete(name = "Number of babies") +
  ggtitle("Title of the Plot") +
  annotate("rect", xmin = 1, xmax = 3, ymin = 0, ymax = max(InsectSprays$count),
           alpha = .2, fill = "orange")

p1
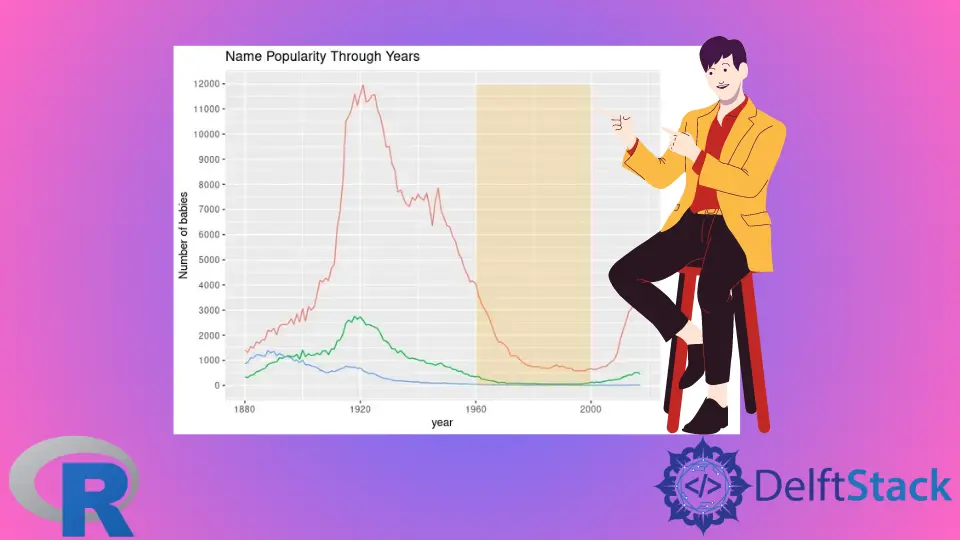
或者,可以使用 annotate 函数在折线图上绘制一个矩形并突出显示绘图的特定范围。请注意,当比例具有数值时,*min/*max 参数可以从这些范围中获取精确值。
library(ggplot2)
library(babynames)
library(dplyr)

dat <- babynames %>%
  filter(name %in% c("Alice", "Maude", "Mae")) %>%
  filter(sex=="F")

p1 <- ggplot(dat, aes(x = year, y = n, color = name)) +
  geom_line() +
  scale_y_continuous(
    breaks = seq(0, 15000, 1000),
    name = "Number of babies") +
  ggtitle("Name Popularity Through Years") +
  annotate("rect", xmin = 1960, xmax = 2000, ymin = -1, ymax = max(dat$n),
         alpha = .2, fill = "orange")

p1
Enjoying our tutorials? Subscribe to DelftStack on YouTube to support us in creating more high-quality video guides. Subscribe
作者: Jinku Hu
