Matplotlib 烛台图
在本演示中,我们将介绍烛台图或绘图,并了解如何使用 Python Matplotlib 中的 mplfinance 模块创建 OHLC(开盘价、最高价、最低价、收盘价)烛台图。
使用 Matplotlib 中的 mplfinance 库创建烛台图
Matplotlib 金融 API 使绘制股价变得容易。它需要安装在我们机器上的 pandas 和 mplfinance 模块。
mplfinance 模块可以非常轻松地完成各种操作,例如 OHLC 图表、烛台图甚至是点数图,所有这些都在一条线上。
举个例子,首先要做的是获取一些数据。我们从雅虎财经下载了 2019 年至 2020 年的亚马逊股价。
要下载,请转到雅虎财经,搜索亚马逊,然后转到历史数据选项卡,以便在此处下载。我们使用的是亚马逊的股价,但你可以使用任何你喜欢的数据股价。
如果你的机器上没有安装 mplfinance 模块,你必须安装它。
pip install mplfinance
导入以下所需模块。
# %matplotlib inline
import pandas as pd
import mplfinance as mplf
下面这一行将在不使用 show() 方法的情况下内联显示我们的绘图或图表,但是如果我们使用不同的 IDLE,例如 pycharm,我们不需要编写这一行,因为它会产生错误。
%matplotlib inline
让我们创建一个名为 file 的变量,并将其作为我们下载的 CSV 文件的名称。确保你位于正确的文件路径位置,否则你必须将路径放在这里并使用 os Python 包。
file = "AMZN.csv"
然后我们将创建一个数据框并读取 CSV 文件。
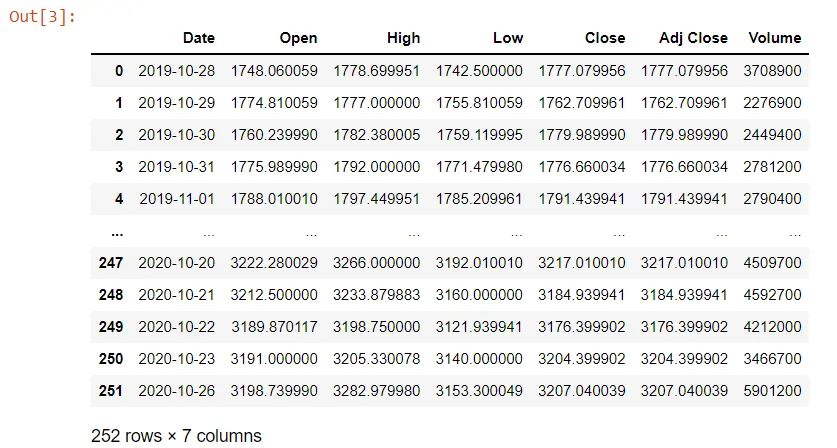
data = pd.read_csv(file)
下面称为数据框。它是 252 行乘 7 列,我们在这里有这些列,可以看到它是自动索引的。
data
如果你将代码写入不同的 IDLE,则上述行将不起作用。你需要打印它以查看你的数据。
有时当我们从 yahoo 下载数据时,列的名称前面有空格。这可能很烦人,所以你必须改变它。
我们将把 Date 列转换为 datetime,因为对象是一个字符串。我们需要使用 pandas to_datetime() 方法将其转换为 datetime。
我们可以使用 info() 方法查看 Date 列的摘要及其数据类型。
data.Date = pd.to_datetime(data.Date)
data.info()
当我们执行它时,我们现在将看到我们有一个 datetime 数据类型,而不是之前我们有一个对象。
<class 'pandas.core.frame.DataFrame'>
RangeIndex: 252 entries, 0 to 251
Data columns (total 7 columns):
 #   Column     Non-Null Count  Dtype
---  ------     --------------  -----
 0   Date       252 non-null    datetime64[ns]
 1   Open       252 non-null    float64
 2   High       252 non-null    float64
 3   Low        252 non-null    float64
 4   Close      252 non-null    float64
 5   Adj Close  252 non-null    float64
 6   Volume     252 non-null    int64
dtypes: datetime64[ns](1), float64(5), int64(1)
memory usage: 13.9 KB
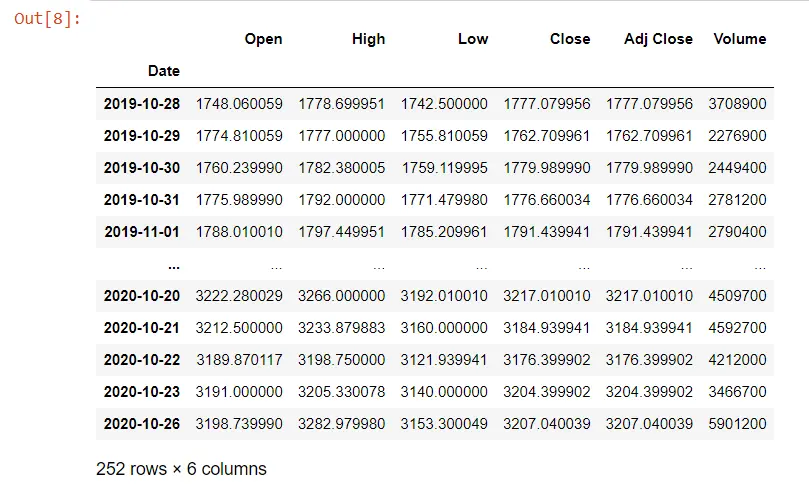
如果我们想操纵这些数据来显示我们的图表,我们需要访问日期列,因为我们将显示与日期相对应的股价。我们需要使索引成为我们数据框的 Date 列,并且该索引将自动添加填充。
data = data.set_index("Date")
data
Date 列现在是我们的索引。
我们将在以下示例中使用财务 API。我们有我们的数据和类型 mplf,这是我们对 mplfinance 模块的引用。
我们从这个模块调用 plot() 方法。
# %matplotlib inline # remove this line when use do not use jupyter notebook
import pandas as pd
import mplfinance as mplf

file = "AMZN.csv"
data = pd.read_csv(file)
data.Date = pd.to_datetime(data.Date)
data.info()
data = data.set_index("Date")
mplf.plot(data)
# use this when you are not using jupyter notebook
mplf.show()
输出:
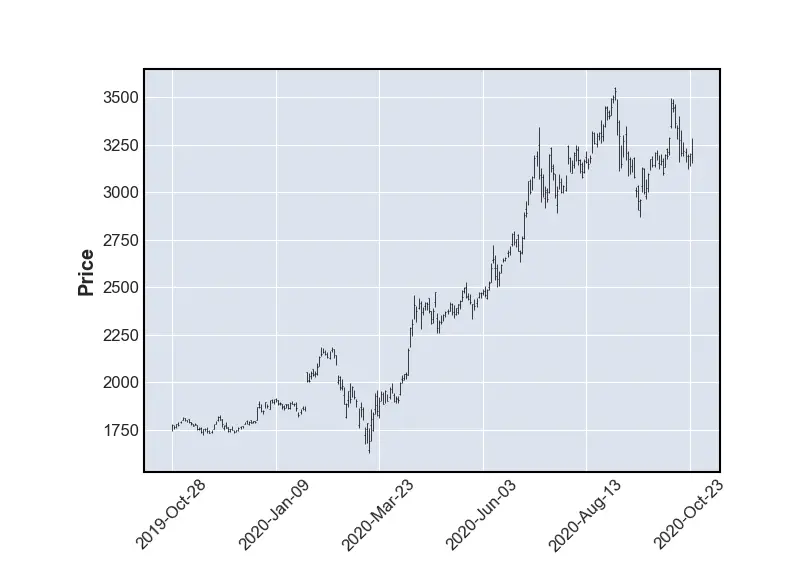
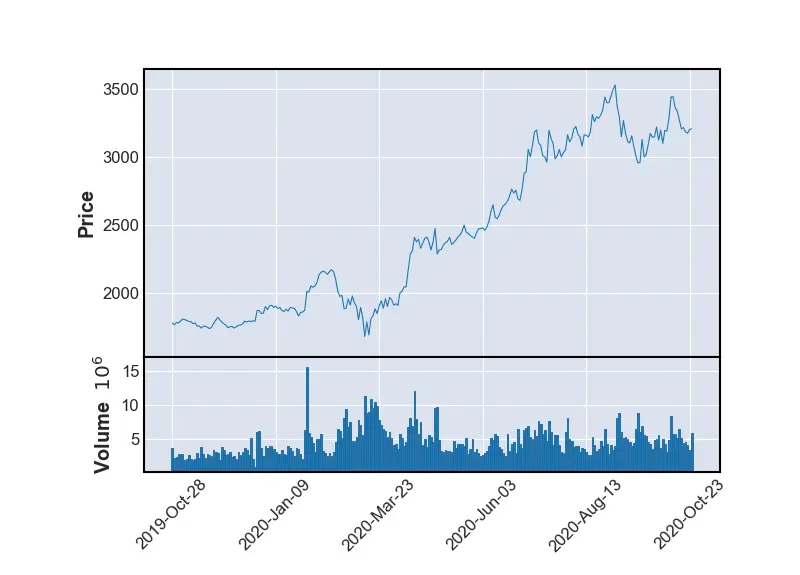
如果我们想显示体积,我们将制作一个线图,因为在这个比例上更容易看到并且体积为 True。
# %matplotlib inline # remove this line when we use jupyter notebook
import pandas as pd
import mplfinance as mplf

file = "AMZN.csv"
data = pd.read_csv(file)
data.Date = pd.to_datetime(data.Date)
data.info()
data = data.set_index("Date")
mplf.plot(data, type="line", volume=True)
# use this when you are not using jupyter notebook
mplf.show()
我们有一个与 OHLC 图不同的线图。我们也有卷,所以我们可以看到它在这里为我们做了一些事情。
它已经标记了轴并旋转了这些标签。
输出:
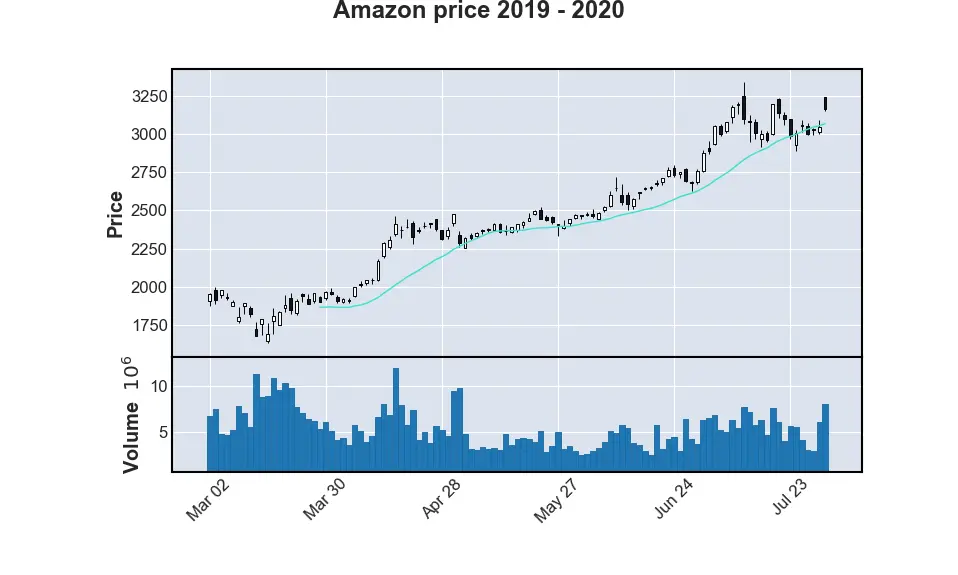
让我们在 pandas 中使用时间序列寻找几个月。我们使用 mav 参数将 5 月至 7 月的数据放入移动平均线,然后我们将类型指定为名为 candlestick 的蜡烛,我们将保持交易量。
# %matplotlib inline # remove this line when wuse do not use jupyter notebook
import pandas as pd
import mplfinance as mplf

file = "AMZN.csv"
data = pd.read_csv(file)
data.Date = pd.to_datetime(data.Date)
data.info()
data = data.set_index("Date")

mplf.plot(
    data.loc["2020-03":"2020-07"],
    figratio=(20, 12),
    title="Amazon price 2019 - 2020",
    type="candle",
    mav=(20),
    volume=True,
)
# use this when you are not using jupyter notebook
mplf.show()
如果我们执行代码,我们会得到一个烛台,一个 OHLC 图表,其交易量仅用于移动平均线。
输出:
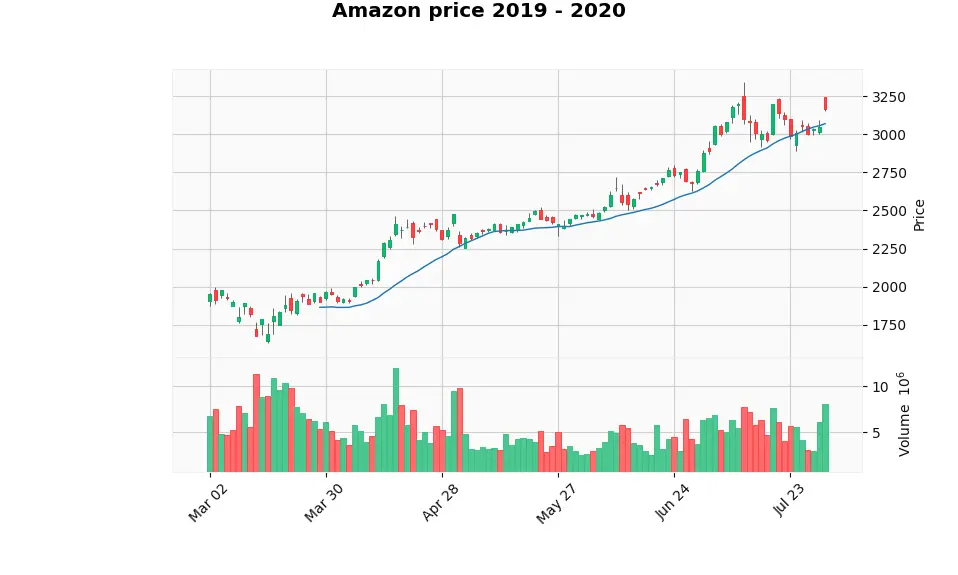
我们可以使用 style 参数来更改绘图外观的样式,将 "yahoo" 设置为此方法的值。
# %matplotlib inline # remove this line when wuse do not use jupyter notebook
import pandas as pd
import mplfinance as mplf

file = "AMZN.csv"
data = pd.read_csv(file)
data.Date = pd.to_datetime(data.Date)
data.info()
data = data.set_index("Date")

mplf.plot(
    data.loc["2020-03":"2020-07"],
    figratio=(20, 12),
    title="Amazon price 2019 - 2020",
    type="candle",
    mav=(20),
    volume=True,
    style="yahoo",
)
# use this when you are not using jupyter notebook
mplf.show()
输出:

Hello! I am Salman Bin Mehmood(Baum), a software developer and I help organizations, address complex problems. My expertise lies within back-end, data science and machine learning. I am a lifelong learner, currently working on metaverse, and enrolled in a course building an AI application with python. I love solving problems and developing bug-free software for people. I write content related to python and hot Technologies.
LinkedIn