Matplotlib Tutorial - Line Chart

We start from plotting the basic chart type - line chart. plot could easily plot out lines like Linear line or curved line, and also have different configuration such as colors, width, marker size, etc.
Matplotlib Linear Line
# -*- coding: utf-8 -*-
import numpy as np
import matplotlib.pyplot as plt

x = np.linspace(0, 9, 10)
y = 2 * x
plt.plot(x, y, "b-")
plt.show()
It plots the line of y=2*x, where x is in the range between 0 and 9.
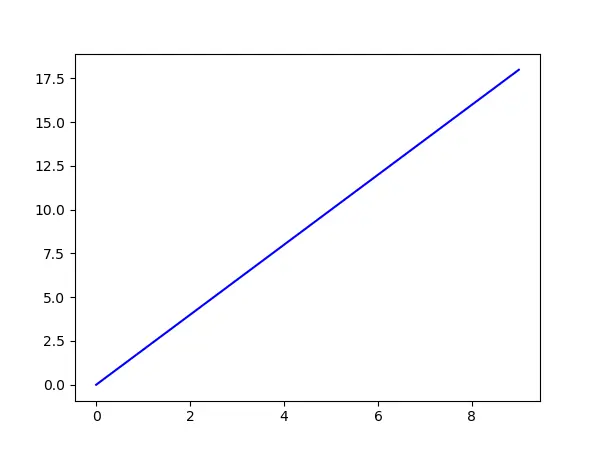
plt.plot(x, y, "b-")
It plots the data of x and y with a line style of b - blue color and - - solid line.
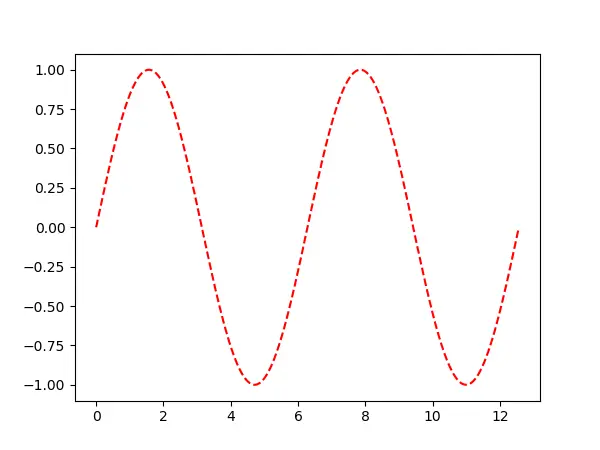
Matplotlib Curved Line
# -*- coding: utf-8 -*-
import numpy as np
import matplotlib.pyplot as plt

x = np.linspace(0, 4 * np.pi, 1000)
y = np.sin(x)

plt.plot(x, y, "r--")

plt.show()
It generates a sinusoidal waveform, and has the line style as color red - r and dashed line - --.
Matplotlib Line Type
You could change the line type like width, color and line-style with different input arguments in plt.plot() function.
matplotlib.pyplot.plot(*args, **kwargs)
Parameters
| Name | Descritpion |
|---|---|
x, y |
The horizontal / vertical coordinates of the data points |
fmt |
A format string, e.g. b- for blue solid line. |
**kwargs
| Property | Description |
|---|---|
color or c |
any matplotlib color |
figure |
a Figure instance |
label |
object |
linestyle or ls |
[‘solid’ | ‘dashed’, ‘dashdot’, ‘dotted’ | (offset, on-off-dash-seq) | '-'] |
linewidth or lw |
line width in points |
marker |
A valid marker style |
markersize or ms |
float |
xdata |
1D array |
ydata |
1D array |
zorder |
float |
Line Color
You have some methods to name the color in the color argument.
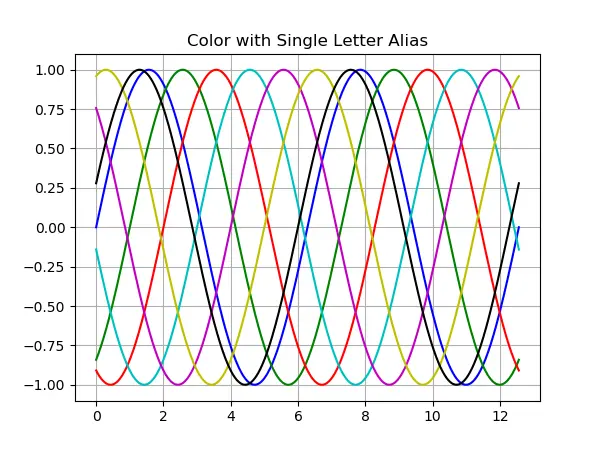
Single Letter Alias
The basic built-in colors have the alias as below,
| Alias | Color |
|---|---|
b |
blue |
g |
green |
r |
red |
c |
cyan |
m |
magenta |
y |
yellow |
k |
black |
w |
white |
HTML Hex String
You could pass an valid html hex string to the color parameter, like
color = "#f44265"
RGB Tuple
You could also specify the color using an R,G,B tuple, where R, G, B value are in the range of [0, 1] instead of normal range of [0, 255].
The color represented with html hex string above has the RGB value of (0.9569, 0.2588, 0.3891).
color = (0.9569, 0.2588, 0.3891)
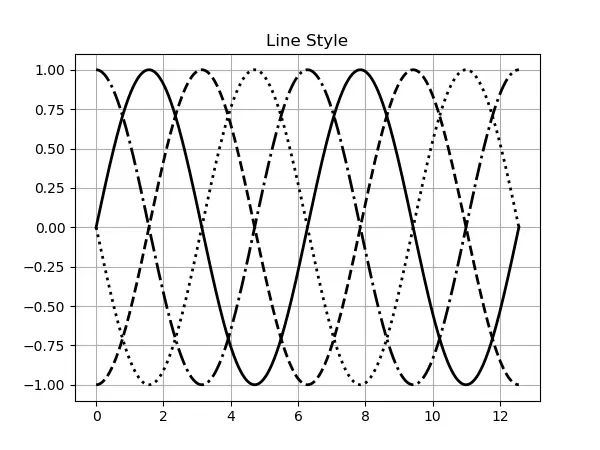
Line Style
Matplotlib has 4 built-in line styles,
| Line Style | |
|---|---|
- |
 |
-- |
 |
: |
 |
:- |
 |
# -*- coding: utf-8 -*-
import numpy as np
import matplotlib.pyplot as plt

x = np.linspace(0, 4 * np.pi, 1000)


for index, line_style in enumerate(["-", "--", ":", "-."]):
    y = np.sin(x - index * np.pi / 2)
    plt.plot(x, y, "k", linestyle=line_style, lw=2)

plt.title("Line Style")
plt.grid(True)

plt.show()
Line Width
You could specify the line width with the parameter linewidth as in
linewidth = 2 # unit is points
or simply use its abbreviation,
lw = 2
# -*- coding: utf-8 -*-
import numpy as np
import matplotlib.pyplot as plt

x = np.linspace(0, 20, 21)

for line_width in [0.5, 1, 2, 4, 8]:
    y = line_width * x
    plt.plot(x, y, "k", linewidth=line_width)

plt.title("Line Width")
plt.grid(True)

plt.show()


Founder of DelftStack.com. Jinku has worked in the robotics and automotive industries for over 8 years. He sharpened his coding skills when he needed to do the automatic testing, data collection from remote servers and report creation from the endurance test. He is from an electrical/electronics engineering background but has expanded his interest to embedded electronics, embedded programming and front-/back-end programming.
LinkedIn Facebook