How to Create Seaborn Subplots
-
Use the
matplotlib.pyplot.subplotsFunction for Plotting Seaborn Subplots in Python -
Use the
matplotlib.pyploy.add_subplot()Function for Plotting Seaborn Subplots in Python

In this tutorial, we will learn how to plot seaborn subplots in Python.
Use the matplotlib.pyplot.subplots Function for Plotting Seaborn Subplots in Python
We know that most of the seaborn plots return a matplotlib axes object. So we can use the subplots() function to plot subplots.
First, we will create the required figure using this function and create the grid for the entire subplots. We will then proceed to plot the necessary graphs.
The following code will explain this.
import pandas as pd
import matplotlib.pyplot as plt
import seaborn as sns

fig, axes = plt.subplots(1, 2)

Using the above code snipped, we were able to divide our final figure into 1x2 subplots. The axes object returned is a numpy array of the specified size, in our example 1x2. We will use this object when plotting the subplots. We will specify the required position for the subplot using the ax parameter in the seaborn plot functions.
See the below code snippet.
import pandas as pd
import matplotlib.pyplot as plt
import seaborn as sns


df = pd.DataFrame(
    {
        "Price 1": [7, 1, 5, 6, 3, 10, 5, 8],
        "Price 2": [1, 2, 8, 4, 3, 9, 5, 2],
        "Day": [1, 2, 3, 4, 5, 6, 7, 8],
    }
)


fig, axes = plt.subplots(1, 2)

sns.lineplot(x="Day", y="Price 1", data=df, ax=axes[0])
sns.lineplot(x="Day", y="Price 2", data=df, ax=axes[1])
axes[0].set_title("First")
axes[1].set_title("Second")
plt.suptitle("Main")
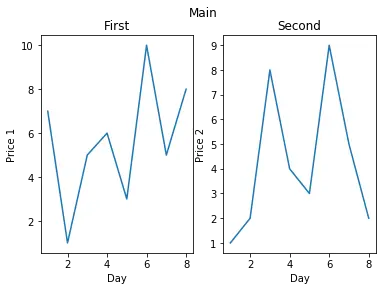
We can use the axes object to add customizations to the individual plots like adding titles and everything. Notice that we use the suptitle() function to add a title to the main plot.
Use the matplotlib.pyploy.add_subplot() Function for Plotting Seaborn Subplots in Python
Unlike the previous method, this function can be used to create subplots dynamically. In our example, we will use a for loop to create an axes object with the subplots.
import pandas as pd
import matplotlib.pyplot as plt
import seaborn as sns

df = pd.DataFrame(
    {
        "Price 1": [7, 1, 5, 6, 3, 10, 5, 8],
        "Price 2": [1, 2, 8, 4, 3, 9, 5, 2],
        "Day": [1, 2, 3, 4, 5, 6, 7, 8],
    }
)

fig = plt.figure()

for i in range(1, 3):
    axes = fig.add_subplot(1, 2, i)
    if i == 1:
        sns.lineplot(x="Day", y="Price 1", data=df)
    else:
        sns.lineplot(x="Day", y="Price 2", data=df)
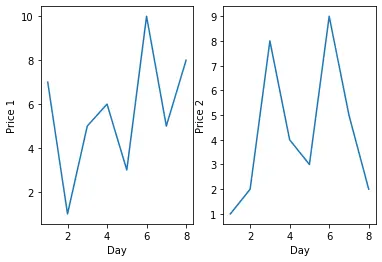
We created a 1x2 subplot for our figure. The i parameter is used for accessing the plots individually. We will use it while plotting also. We can use the subplots_adjust() function to adjust the spacing and everything in the final figure.

Manav is a IT Professional who has a lot of experience as a core developer in many live projects. He is an avid learner who enjoys learning new things and sharing his findings whenever possible.
LinkedIn