Seaborn サブプロット
-
Python で Seaborn サブプロットをプロットするには、
matplotlib.pyplot.subplots関数を使用する -
Python で Seaborn サブプロットをプロットするには、
matplotlib.pyploy.add_subplot()関数を使用する
このチュートリアルでは、Python で Seaborn のサブプロットをプロットする方法を学習します。
Python で Seaborn サブプロットをプロットするには、matplotlib.pyplot.subplots 関数を使用する
ほとんどの Seaborn のプロットが matplotlib 軸オブジェクトを返すことはわかっています。したがって、subplots() 関数を使用してサブプロットをプロットできます。
まず、この関数を使用して必要な図を作成し、サブプロット全体のグリッドを作成します。次に、必要なグラフのプロットに進みます。
次のコードはこれを説明します。
import pandas as pd
import matplotlib.pyplot as plt
import seaborn as sns

fig, axes = plt.subplots(1, 2)

上記のコードを抜粋して使用すると、最終的な図を 1x2 のサブプロットに分割することができました。返される Axes オブジェクトは、指定されたサイズの numpy 配列(この例では 1x2)です。サブプロットをプロットするときにこのオブジェクトを使用します。Seaborn のプロット関数の ax パラメーターを使用して、サブプロットに必要な位置を指定します。
以下のコードスニペットを参照してください。
import pandas as pd
import matplotlib.pyplot as plt
import seaborn as sns


df = pd.DataFrame(
    {
        "Price 1": [7, 1, 5, 6, 3, 10, 5, 8],
        "Price 2": [1, 2, 8, 4, 3, 9, 5, 2],
        "Day": [1, 2, 3, 4, 5, 6, 7, 8],
    }
)


fig, axes = plt.subplots(1, 2)

sns.lineplot(x="Day", y="Price 1", data=df, ax=axes[0])
sns.lineplot(x="Day", y="Price 2", data=df, ax=axes[1])
axes[0].set_title("First")
axes[1].set_title("Second")
plt.suptitle("Main")
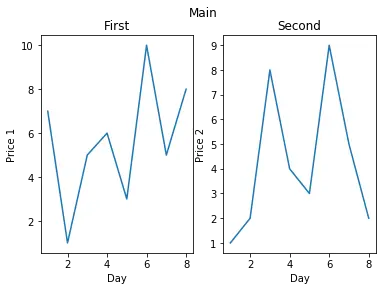
axis オブジェクトを使用して、タイトルなどすべてを追加するなど、個々のプロットにカスタマイズを追加できます。suptitle() 関数を使用して、メインプロットにタイトルを追加していることに注意してください。
Python で Seaborn サブプロットをプロットするには、matplotlib.pyploy.add_subplot() 関数を使用する
前の方法とは異なり、この関数を使用してサブプロットを動的に作成できます。この例では、for ループを使用して、サブプロットで axes オブジェクトを作成します。
import pandas as pd
import matplotlib.pyplot as plt
import seaborn as sns

df = pd.DataFrame(
    {
        "Price 1": [7, 1, 5, 6, 3, 10, 5, 8],
        "Price 2": [1, 2, 8, 4, 3, 9, 5, 2],
        "Day": [1, 2, 3, 4, 5, 6, 7, 8],
    }
)

fig = plt.figure()

for i in range(1, 3):
    axes = fig.add_subplot(1, 2, i)
    if i == 1:
        sns.lineplot(x="Day", y="Price 1", data=df)
    else:
        sns.lineplot(x="Day", y="Price 2", data=df)
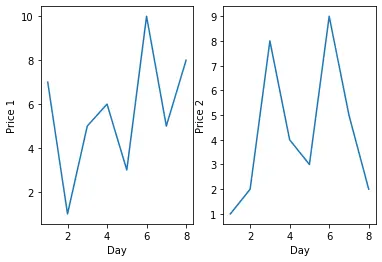
図の 1x2 サブプロットを作成しました。i パラメータは、プロットに個別にアクセスするために使用されます。プロットしながらも使用します。subplots_adjust() 関数を使用して、最終的な図の間隔とすべてを調整できます。

Manav is a IT Professional who has a lot of experience as a core developer in many live projects. He is an avid learner who enjoys learning new things and sharing his findings whenever possible.
LinkedIn