TUTORIAL · Matplotlib
Matplotlib Tutorial - Pie Chart
This tutorial introduces pie chart in Matplotlib
On this page
We will learn pie chart in this tutorial.
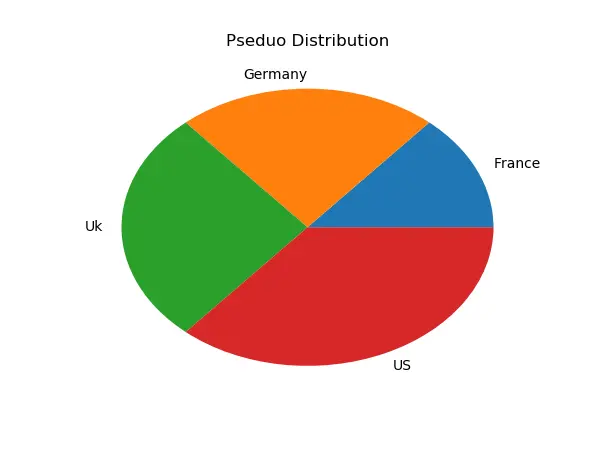
Matplotlib Pie Chart
# -*- coding: utf-8 -*-
import matplotlib.pyplot as plt


x = np.array([15, 25, 30, 40])
label = ["France", "Germany", "Uk", "US"]

plt.pie(x, labels=label)
plt.show()
Syntax
matplotlib.pyplot.pie(
    x,
    explode=None,
    labels=None,
    colors=None,
    autopct=None,
    pctdistance=0.6,
    shadow=False,
    labeldistance=1.1,
    startangle=None,
    radius=None,
    counterclock=True,
    wedgeprops=None,
    textprops=None,
    center=(0, 0),
    frame=False,
    hold=None,
    data=None,
)
Parameters
| Name | Description |
|---|---|
label |
label text |
fontdict |
label text font dictionary, like family, color, weight and size |
labelpad |
Spacing in points between the label and the x-axis |
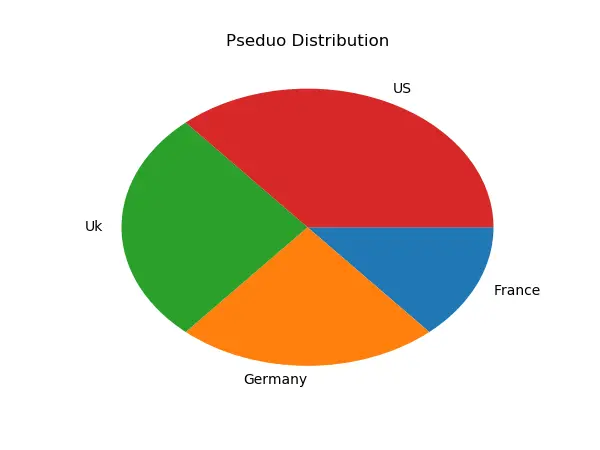
Matplotlib Pie Chart in Clockwise Direction
If the argument counterclock is set to be False, then the pie chart will be drawn in clockwise direction.
# -*- coding: utf-8 -*-
import matplotlib.pyplot as plt


x = np.array([15, 25, 30, 40])
label = ["France", "Germany", "Uk", "US"]

plt.pie(x, labels=label, counterclock=False)
plt.show()
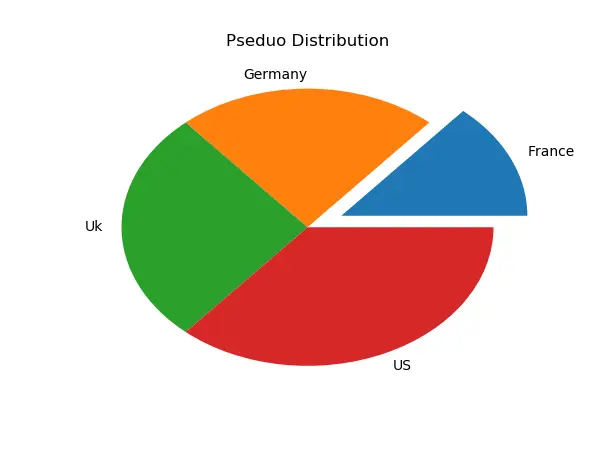
Matplotlib Pie Chart With Explode Slice
The explode parameter controls the explode of slices in pie charts. It specifies the fraction of the radius with which offset each wedge.
# -*- coding: utf-8 -*-
import matplotlib.pyplot as plt


x = np.array([15, 25, 30, 40])
label = ["France", "Germany", "Uk", "US"]

plt.pie(x, labels=label, explode=(0.2, 0, 0, 0))
plt.show()