R의 scale_y_continuous 함수
-
scale_y_continuous를 사용하여 R의 백분율로 Y 축 레이블 인쇄 -
scale_y_continuous를 사용하여 R에서 Y 축의 배율 비율 설정 -
scale_y_continuous를 사용하여 R에서 Y 축의 레이블 제거 -
scale_y_continuous를 사용하여 R에서 사용자 정의 값으로 Y 축 레이블 수정

이 기사에서는 R의scale_y_continuous함수를 소개합니다.
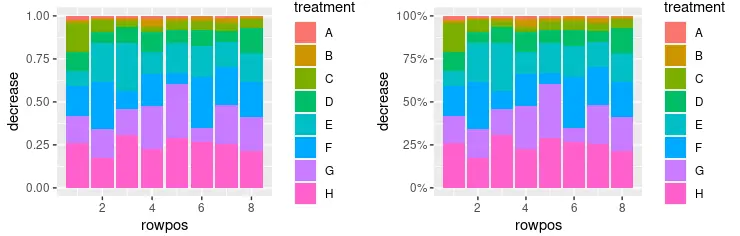
scale_y_continuous를 사용하여 R의 백분율로 Y 축 레이블 인쇄
scale_y_continuous는 연속적인 y 축 스케일 미학을위한 값을 설정하는 데 사용됩니다. 이 함수는ggplot2 패키지의 일부이며 대부분ggplot 객체와 함께 사용되어 그릴 그래프에 대해 다른 매개 변수를 수정합니다. 이 예에서는scale_y_continuous를 사용하여 Y 축 레이블을 백분율 값으로 인쇄하는 방법을 보여줍니다. 누적 막대 그래프는geom_col(position = "fill")함수 호출을 사용하여 생성되고 백분율은scales::percent 함수를labels 매개 변수 값으로 사용하여 인쇄됩니다. library 호출을 사용하여scales 패키지를 포함 했으므로이 스크립트의 범위에서percent 표기법을 사용하여 참조 할 수 있습니다.
library(ggplot2)
library(gridExtra)
library(scales)

p1 <- ggplot(OrchardSprays, aes(x = rowpos, y = decrease, fill = treatment)) +
  geom_col(position = "fill")

p2 <- ggplot(OrchardSprays, aes(x = rowpos, y = decrease, fill = treatment)) +
  geom_col(position = "fill") +
  scale_y_continuous(labels = percent)

grid.arrange(p1, p2, ncol = 2, nrow =2)
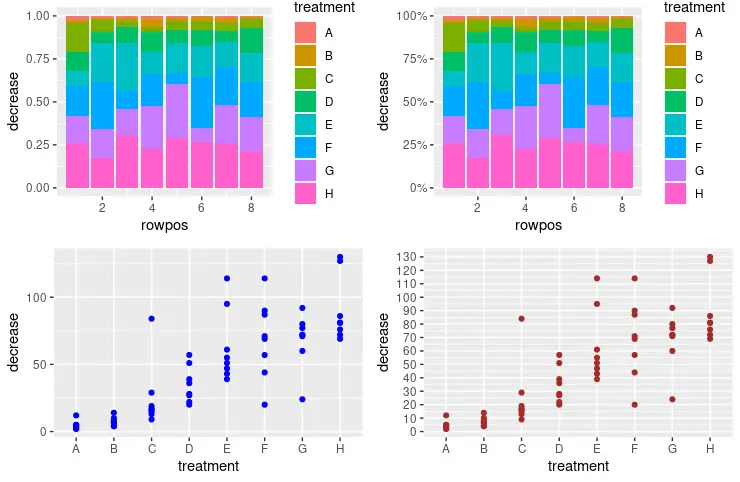
scale_y_continuous를 사용하여 R에서 Y 축의 배율 비율 설정
scale_y_continuous를 사용하여 y 축 스케일 및 증분 값을 설정하여 다음 라벨을 인쇄 할 수도 있습니다. seq함수는scale_y_continuous호출의breaks매개 변수에 번호 시퀀스를 전달하는 데 사용됩니다. 숫자를seq(from, to, by= )표현으로 해석합니다.
library(ggplot2)
library(gridExtra)
library(scales)

p1 <- ggplot(OrchardSprays, aes(x = rowpos, y = decrease, fill = treatment)) +
  geom_col(position = "fill")

p2 <- ggplot(OrchardSprays, aes(x = rowpos, y = decrease, fill = treatment)) +
  geom_col(position = "fill") +
  scale_y_continuous(labels = percent)

p3 <- ggplot(OrchardSprays, aes(x = treatment, y = decrease)) +
  geom_point(colour = "blue")

p4 <- ggplot(OrchardSprays, aes(x = treatment, y = decrease)) +
  geom_point(colour = "brown") +
  scale_y_continuous(breaks = seq(0, 150, 10))

grid.arrange(p1, p2, p3, p4, ncol = 2, nrow =2)
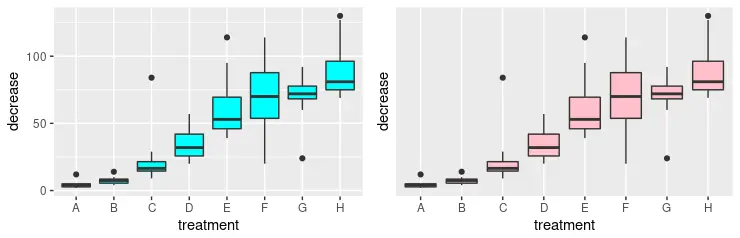
scale_y_continuous를 사용하여 R에서 Y 축의 레이블 제거
또는scale_y_continuous함수를 사용하여 y 축의 레이블을 완전히 제거 할 수 있습니다. 이를 위해NULL값을breaks매개 변수로 전달해야합니다. grid.arrange함수로 시각적 비교를 위해 두 개의 그래프를 그립니다.
library(ggplot2)
library(gridExtra)

p3 <- ggplot(OrchardSprays, aes(x = treatment, y = decrease)) +
  geom_boxplot(fill = "cyan")

p4 <- ggplot(OrchardSprays, aes(x = treatment, y = decrease)) +
  geom_boxplot(fill = "pink") +
  scale_y_continuous(breaks = NULL)

grid.arrange(p3, p4, ncol = 2, nrow =2)
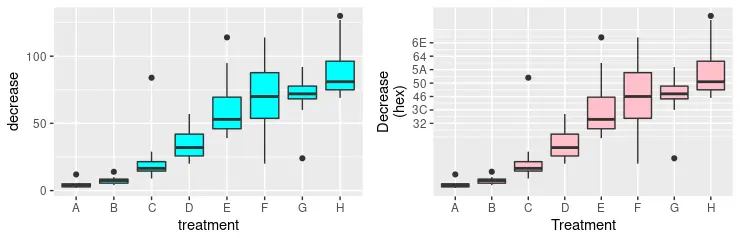
scale_y_continuous를 사용하여 R에서 사용자 정의 값으로 Y 축 레이블 수정
이전 방법 중 일부를 혼합하여 y 축 미학의 고급 서식을 형성 할 수 있습니다. 다음 코드 스 니펫에서는 인쇄 할 여러 레이블을 명시 적으로 지정하고labels매개 변수를 사용하여 동시에 새 값을 정의합니다. 새 값은 해당 숫자에 대한 16 진수 표기법 일뿐입니다. 마지막으로,scale_x_discrete함수를 사용하여 수행되는 주어진 문자열과 x 축으로 y 축 스케일의 이름을 바꿉니다.
library(ggplot2)
library(gridExtra)

p3 <- ggplot(OrchardSprays, aes(x = treatment, y = decrease)) +
  geom_boxplot(fill = "cyan")

p4 <- ggplot(OrchardSprays, aes(x = treatment, y = decrease)) +
  geom_boxplot(fill = "pink") +
  scale_y_continuous(
    breaks = c(50, 60, 70, 80, 90, 100, 110),
    labels = c("32", "3C", "46", "50", "5A", "64", "6E"),
    name = "Decrease\n(hex)") +
  scale_x_discrete(name = "Treatment")

grid.arrange(p3, p4, ncol = 2, nrow =2)

Founder of DelftStack.com. Jinku has worked in the robotics and automotive industries for over 8 years. He sharpened his coding skills when he needed to do the automatic testing, data collection from remote servers and report creation from the endurance test. He is from an electrical/electronics engineering background but has expanded his interest to embedded electronics, embedded programming and front-/back-end programming.
LinkedIn Facebook