Seaborn プロットの軸ティックラベルを回転させる
-
set_xticklabels()関数を使用して、SeabornAxes のラベルを回転させる -
xticks()関数を使用して、SeabornAxes のラベルを回転させる -
setp()関数を使用して、SeabornAxes のラベルを回転させる

Seaborn は、最終的な図のために多くのカスタマイズを提供します。そのような小さいながらも不可欠なカスタマイズの 1つは、両方の軸の目盛りラベルを制御できることです。
たとえば、次のグラフの問題に注意してください。
import pandas as pd
import matplotlib.pyplot as plt
import seaborn as sns

df = pd.DataFrame(
    {
        "Date": [
            "01012019",
            "01022019",
            "01032019",
            "01042019",
            "01052019",
            "01062019",
            "01072019",
            "01082019",
        ],
        "Price": [77, 76, 68, 70, 78, 79, 74, 75],
    }
)
df["Date"] = pd.to_datetime(df["Date"], format="%d%m%Y")

plt.figure(figsize=(15, 8))
ax = sns.barplot(x="Date", y="Price", data=df)
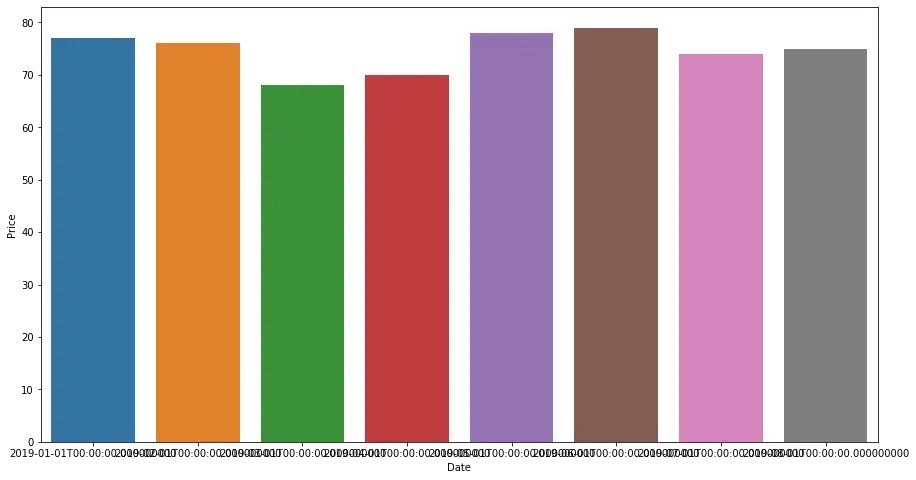
上記のコードでは、製品の価格の時系列データのグラフをプロットしました。ご覧のとおり、日付全体が x 軸にプロットされています。このため、すべてが重なっていて読みにくいです。
このような状況では、軸の目盛りラベルを回転させることができます。
このチュートリアルでは、Seaborn のプロットでそのようなダニのラベルを回転させる方法を学習します。
set_xticklabels() 関数を使用して、SeabornAxes のラベルを回転させる
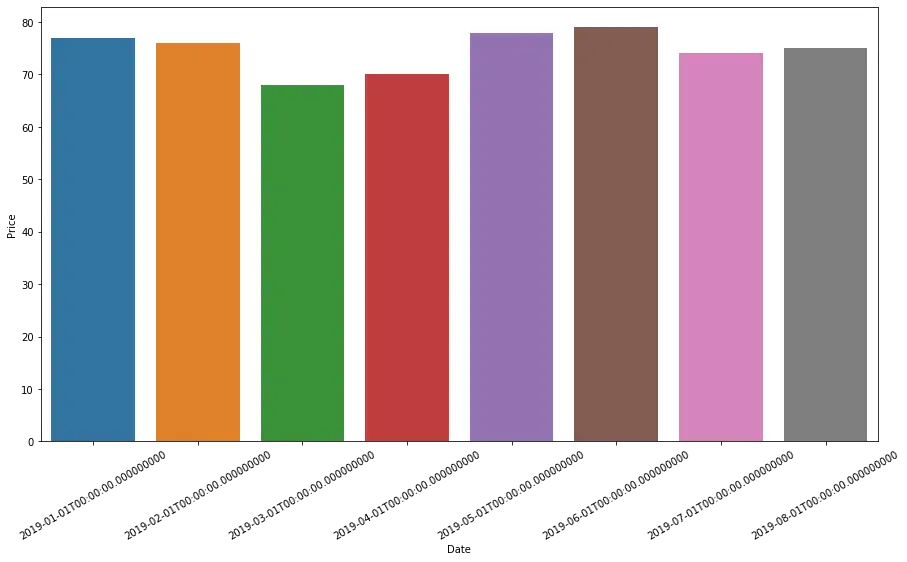
set_xticklabels() 関数は、x 軸の目盛りラベルの値を設定します。これを使用してラベルを回転させることができます。ただし、この関数は、デフォルトのラベルを返し、rotation パラメーターを使用してそれらを回転させる get_xticklabels() 関数を使用するために、いくつかのラベル値を必要とします。
次のコードは、その使用法を示しています。
import pandas as pd
import matplotlib.pyplot as plt
import seaborn as sns

df = pd.DataFrame(
    {
        "Date": [
            "01012019",
            "01022019",
            "01032019",
            "01042019",
            "01052019",
            "01062019",
            "01072019",
            "01082019",
        ],
        "Price": [77, 76, 68, 70, 78, 79, 74, 75],
    }
)
df["Date"] = pd.to_datetime(df["Date"], format="%d%m%Y")

plt.figure(figsize=(15, 8))
ax = sns.barplot(x="Date", y="Price", data=df)
ax.set_xticklabels(ax.get_xticklabels(), rotation=30)
xticks() 関数を使用して、SeabornAxes のラベルを回転させる
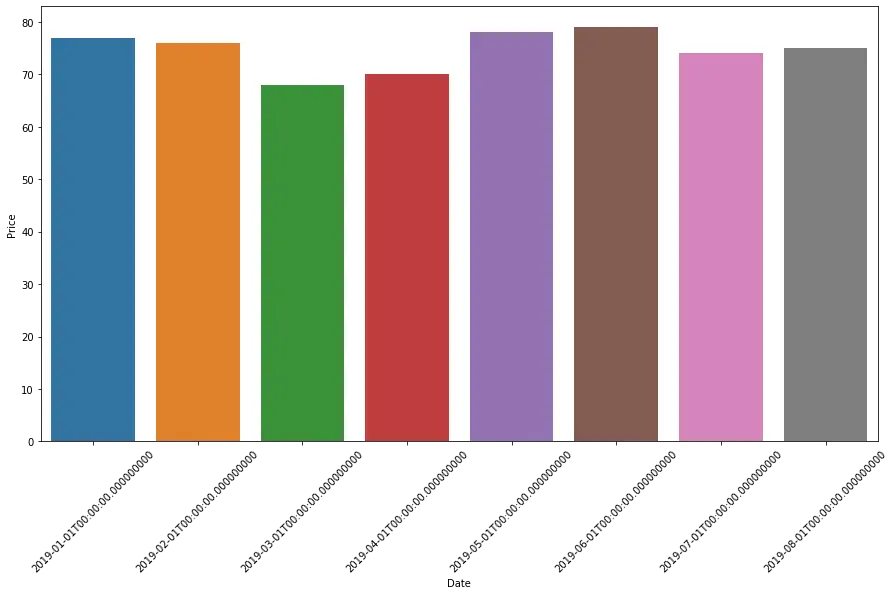
matplotlib.pyplot.xticks() 関数の rotation パラメーターもこれを実現できます。ラベルを渡す必要はなく、この関数でパラメーターを直接使用できます。
例えば、
import pandas as pd
import matplotlib.pyplot as plt
import seaborn as sns

df = pd.DataFrame(
    {
        "Date": [
            "01012019",
            "01022019",
            "01032019",
            "01042019",
            "01052019",
            "01062019",
            "01072019",
            "01082019",
        ],
        "Price": [77, 76, 68, 70, 78, 79, 74, 75],
    }
)
df["Date"] = pd.to_datetime(df["Date"], format="%d%m%Y")

plt.figure(figsize=(15, 8))
ax = sns.barplot(x="Date", y="Price", data=df)
plt.xticks(rotation=45)
setp() 関数を使用して、SeabornAxes のラベルを回転させる
ほとんどの Seaborn のプロットは matplotlib 軸オブジェクトを返すため、このライブラリの setp() 関数を使用できます。xtick() 関数を使用して目盛りラベルの値を取得し、setp() 関数の rotation パラメーターを使用してそれらを回転させます。
次のコードを参照してください。
import pandas as pd
import matplotlib.pyplot as plt
import seaborn as sns

df = pd.DataFrame(
    {
        "Date": [
            "01012019",
            "01022019",
            "01032019",
            "01042019",
            "01052019",
            "01062019",
            "01072019",
            "01082019",
        ],
        "Price": [77, 76, 68, 70, 78, 79, 74, 75],
    }
)
df["Date"] = pd.to_datetime(df["Date"], format="%d%m%Y")

plt.figure(figsize=(15, 8))
ax = sns.barplot(x="Date", y="Price", data=df)
locs, labels = plt.xticks()
plt.setp(labels, rotation=45)


Manav is a IT Professional who has a lot of experience as a core developer in many live projects. He is an avid learner who enjoys learning new things and sharing his findings whenever possible.
LinkedIn