Rotate Axis Tick Labels of Seaborn Plots
-
Usa la funzione
set_xticklabels()per ruotare le etichette sugli assi Seaborn -
Usa la funzione
xticks()per ruotare le etichette sugli assi Seaborn -
Usa la funzione
setp()per ruotare le etichette su Seaborn Axes

Seaborn offre molte personalizzazioni per la figura finale. Una personalizzazione così piccola ma essenziale è che possiamo controllare le etichette di spunta su entrambi gli assi.
Ad esempio, presta attenzione al problema con il seguente grafico.
import pandas as pd
import matplotlib.pyplot as plt
import seaborn as sns

df = pd.DataFrame(
    {
        "Date": [
            "01012019",
            "01022019",
            "01032019",
            "01042019",
            "01052019",
            "01062019",
            "01072019",
            "01082019",
        ],
        "Price": [77, 76, 68, 70, 78, 79, 74, 75],
    }
)
df["Date"] = pd.to_datetime(df["Date"], format="%d%m%Y")

plt.figure(figsize=(15, 8))
ax = sns.barplot(x="Date", y="Price", data=df)
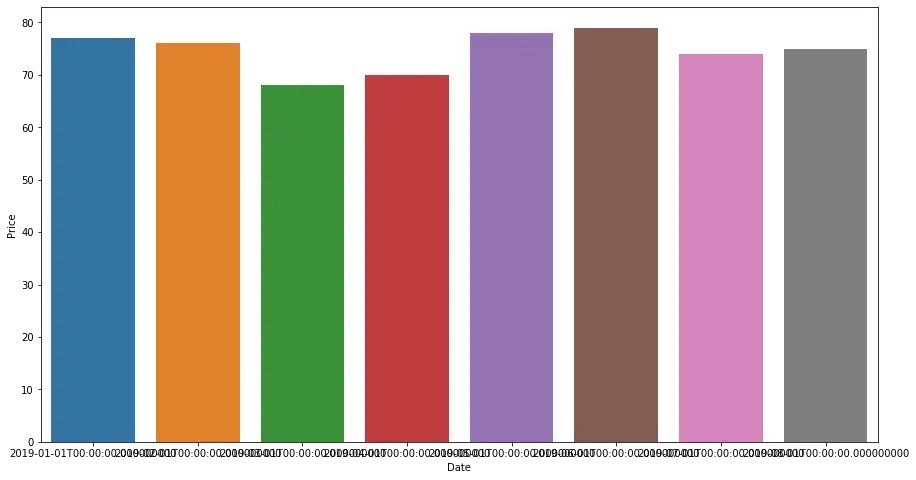
Nel codice sopra, abbiamo tracciato un grafico per i dati delle serie temporali del prezzo di un prodotto. Come puoi vedere, intere date sono tracciate sull’asse x. A causa di ciò, tutto è sovrapposto ed è difficile da leggere.
Per tali situazioni, possiamo ruotare le etichette di spunta sull’asse.
In questo tutorial, impareremo come ruotare tali etichette di spunta su appezzamenti di origine marina.
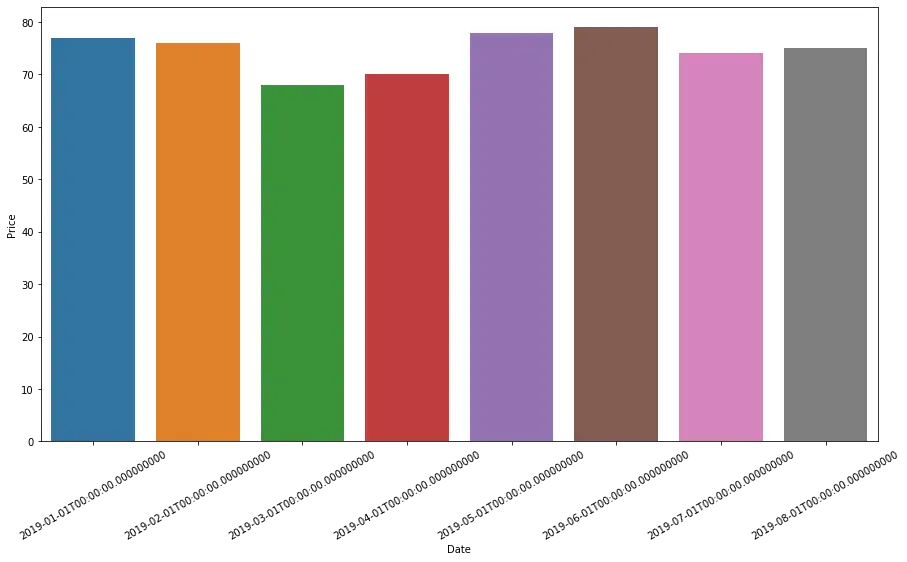
Usa la funzione set_xticklabels() per ruotare le etichette sugli assi Seaborn
La funzione set_xticklabels() imposta i valori per le etichette tick sull’asse x. Possiamo usarlo per ruotare le etichette. Tuttavia, questa funzione necessita di alcuni valori di etichetta per utilizzare la funzione get_xticklabels() che restituisce le etichette predefinite e le ruota utilizzando il parametro rotation.
Il codice seguente ne dimostra l’utilizzo.
import pandas as pd
import matplotlib.pyplot as plt
import seaborn as sns

df = pd.DataFrame(
    {
        "Date": [
            "01012019",
            "01022019",
            "01032019",
            "01042019",
            "01052019",
            "01062019",
            "01072019",
            "01082019",
        ],
        "Price": [77, 76, 68, 70, 78, 79, 74, 75],
    }
)
df["Date"] = pd.to_datetime(df["Date"], format="%d%m%Y")

plt.figure(figsize=(15, 8))
ax = sns.barplot(x="Date", y="Price", data=df)
ax.set_xticklabels(ax.get_xticklabels(), rotation=30)
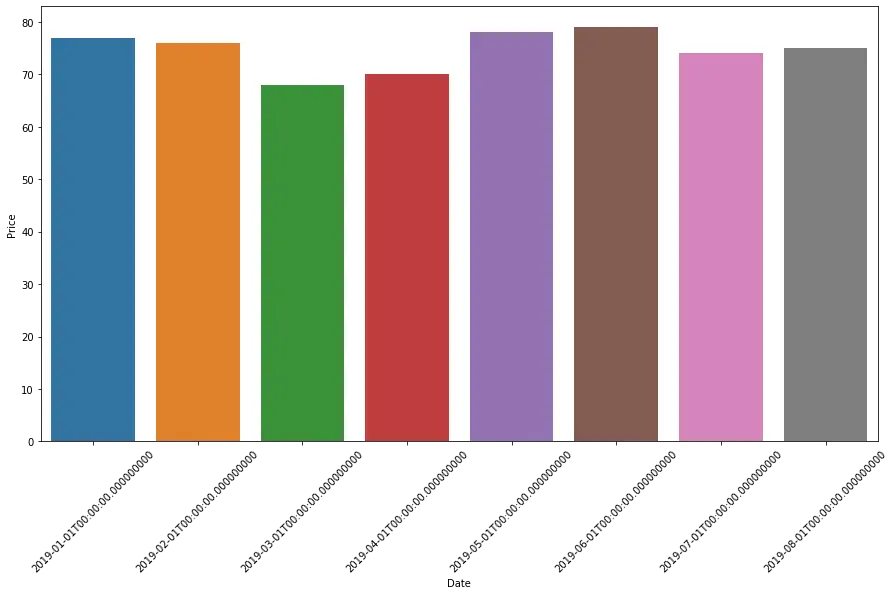
Usa la funzione xticks() per ruotare le etichette sugli assi Seaborn
Anche il parametro rotation nella funzione matplotlib.pyplot.xticks() può raggiungere questo obiettivo. Non è necessario passare alcuna etichetta e possiamo utilizzare direttamente il parametro in questa funzione.
Per esempio,
import pandas as pd
import matplotlib.pyplot as plt
import seaborn as sns

df = pd.DataFrame(
    {
        "Date": [
            "01012019",
            "01022019",
            "01032019",
            "01042019",
            "01052019",
            "01062019",
            "01072019",
            "01082019",
        ],
        "Price": [77, 76, 68, 70, 78, 79, 74, 75],
    }
)
df["Date"] = pd.to_datetime(df["Date"], format="%d%m%Y")

plt.figure(figsize=(15, 8))
ax = sns.barplot(x="Date", y="Price", data=df)
plt.xticks(rotation=45)
Usa la funzione setp() per ruotare le etichette su Seaborn Axes
Poiché la maggior parte dei grafici nati dal mare restituisce un oggetto assi matplotlib, possiamo usare la funzione setp() da questa libreria. Prenderemo i valori dell’etichetta tick usando la funzione xtick() e li ruoteremo usando il parametro rotation della funzione setp().
Vedere il seguente codice.
import pandas as pd
import matplotlib.pyplot as plt
import seaborn as sns

df = pd.DataFrame(
    {
        "Date": [
            "01012019",
            "01022019",
            "01032019",
            "01042019",
            "01052019",
            "01062019",
            "01072019",
            "01082019",
        ],
        "Price": [77, 76, 68, 70, 78, 79, 74, 75],
    }
)
df["Date"] = pd.to_datetime(df["Date"], format="%d%m%Y")

plt.figure(figsize=(15, 8))
ax = sns.barplot(x="Date", y="Price", data=df)
locs, labels = plt.xticks()
plt.setp(labels, rotation=45)


Manav is a IT Professional who has a lot of experience as a core developer in many live projects. He is an avid learner who enjoys learning new things and sharing his findings whenever possible.
LinkedIn