旋轉 Seaborn 圖的軸刻度標籤
Manav Narula
2023年1月30日
Seaborn
Seaborn Axis
Seaborn Label

Seaborn 為最終圖形提供了許多自定義設定。一個如此小但必不可少的定製是我們可以控制兩個軸上的刻度標籤。
例如,注意下圖的問題。
import pandas as pd
import matplotlib.pyplot as plt
import seaborn as sns

df = pd.DataFrame(
    {
        "Date": [
            "01012019",
            "01022019",
            "01032019",
            "01042019",
            "01052019",
            "01062019",
            "01072019",
            "01082019",
        ],
        "Price": [77, 76, 68, 70, 78, 79, 74, 75],
    }
)
df["Date"] = pd.to_datetime(df["Date"], format="%d%m%Y")

plt.figure(figsize=(15, 8))
ax = sns.barplot(x="Date", y="Price", data=df)
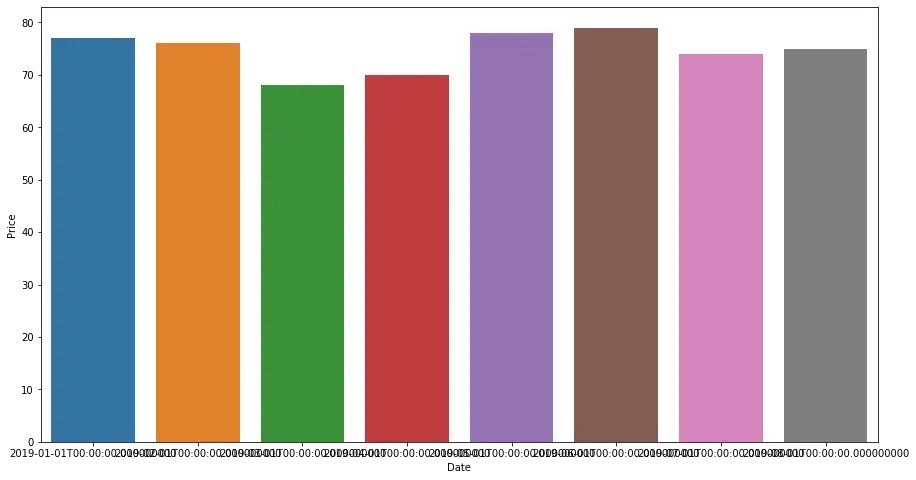
在上面的程式碼中,我們為產品價格的時間序列資料繪製了一個圖表。如你所見,整個日期繪製在 x 軸上。因此,所有內容都重疊並且難以閱讀。
對於這種情況,我們可以在軸上旋轉刻度標籤。
在本教程中,我們將學習如何在 seaborn 圖上旋轉此類刻度標籤。
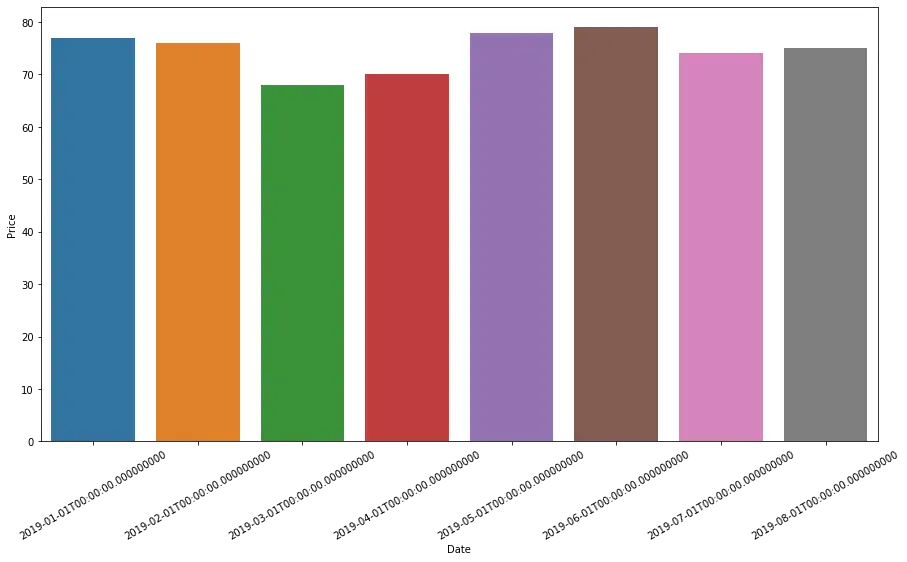
使用 set_xticklabels() 函式在 Seaborn 軸上旋轉標籤
set_xticklabels() 函式設定 x 軸上刻度標籤的值。我們可以用它來旋轉標籤。但是,此函式需要一些標籤值才能使用 get_xticklabels() 函式返回預設標籤並使用 rotation 引數旋轉它們。
下面的程式碼演示了它的用法。
import pandas as pd
import matplotlib.pyplot as plt
import seaborn as sns

df = pd.DataFrame(
    {
        "Date": [
            "01012019",
            "01022019",
            "01032019",
            "01042019",
            "01052019",
            "01062019",
            "01072019",
            "01082019",
        ],
        "Price": [77, 76, 68, 70, 78, 79, 74, 75],
    }
)
df["Date"] = pd.to_datetime(df["Date"], format="%d%m%Y")

plt.figure(figsize=(15, 8))
ax = sns.barplot(x="Date", y="Price", data=df)
ax.set_xticklabels(ax.get_xticklabels(), rotation=30)
使用 xticks() 函式在 Seaborn 軸上旋轉標籤
matplotlib.pyplot.xticks() 函式中的 rotation 引數也可以實現這一點。我們不需要傳遞任何標籤,可以直接使用這個函式中的引數。
例如,
import pandas as pd
import matplotlib.pyplot as plt
import seaborn as sns

df = pd.DataFrame(
    {
        "Date": [
            "01012019",
            "01022019",
            "01032019",
            "01042019",
            "01052019",
            "01062019",
            "01072019",
            "01082019",
        ],
        "Price": [77, 76, 68, 70, 78, 79, 74, 75],
    }
)
df["Date"] = pd.to_datetime(df["Date"], format="%d%m%Y")

plt.figure(figsize=(15, 8))
ax = sns.barplot(x="Date", y="Price", data=df)
plt.xticks(rotation=45)
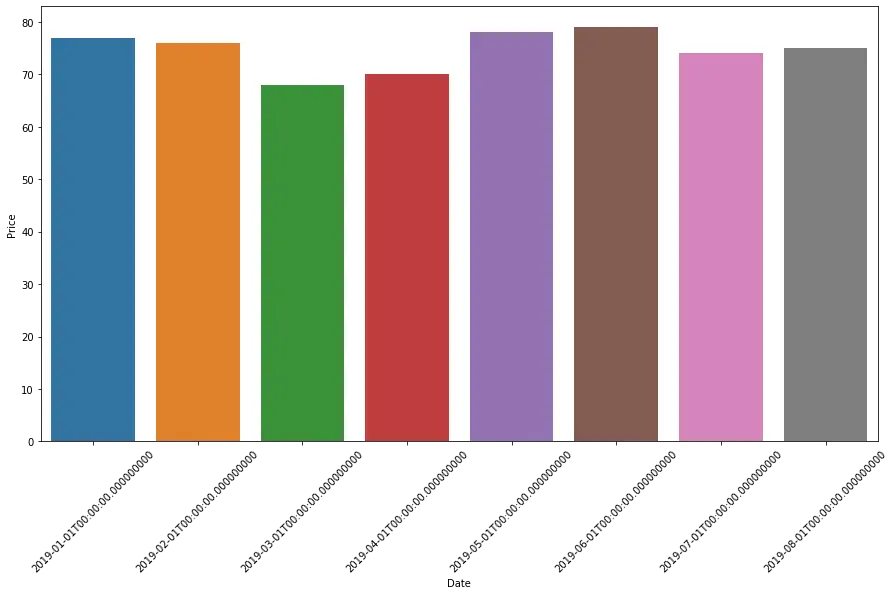
使用 setp() 函式在 Seaborn 軸上旋轉標籤
由於大多數 seaborn 圖返回一個 matplotlib 軸物件,我們可以使用該庫中的 setp() 函式。我們將使用 xtick() 函式獲取刻度標籤值,並使用 setp() 函式的 rotation 引數旋轉它們。
請參考以下程式碼。
import pandas as pd
import matplotlib.pyplot as plt
import seaborn as sns

df = pd.DataFrame(
    {
        "Date": [
            "01012019",
            "01022019",
            "01032019",
            "01042019",
            "01052019",
            "01062019",
            "01072019",
            "01082019",
        ],
        "Price": [77, 76, 68, 70, 78, 79, 74, 75],
    }
)
df["Date"] = pd.to_datetime(df["Date"], format="%d%m%Y")

plt.figure(figsize=(15, 8))
ax = sns.barplot(x="Date", y="Price", data=df)
locs, labels = plt.xticks()
plt.setp(labels, rotation=45)

Enjoying our tutorials? Subscribe to DelftStack on YouTube to support us in creating more high-quality video guides. Subscribe
作者: Manav Narula

Manav is a IT Professional who has a lot of experience as a core developer in many live projects. He is an avid learner who enjoys learning new things and sharing his findings whenever possible.
LinkedIn