在 Seaborn 圖中設定軸刻度
Manav Narula
2023年1月30日
Seaborn
Seaborn Tick
Seaborn Axis
-
在 Python 中使用
matplotlib.pyplot.set_xtickslabels()和matplotlib.pyplot.set_ytickslabels()函式設定 Seaborn 圖上的軸刻度標籤 -
在 Python 中使用
matplotlib.pyplot.xticks()和matplotlib.pyplot.yticks()函式設定 Seaborn 圖上的軸刻度標籤
本教程將介紹在 Python 中為 seaborn 圖設定軸刻度的不同函式。
請注意,在本文中,我們討論了與 x 軸刻度標籤相關的示例。我們可以以完全相同的方式使用 y 軸的方法。
在 Python 中使用 matplotlib.pyplot.set_xtickslabels() 和 matplotlib.pyplot.set_ytickslabels() 函式設定 Seaborn 圖上的軸刻度標籤
這些函式用於為繪圖提供自定義標籤。它們取自 matplotlib 庫,可用於 seaborn 圖。它們通常在 set_xticks 和 set_yticks 函式用於指定刻度標籤的位置之後使用。
它還允許我們改變刻度標籤的字型和大小,甚至在需要時使用不同的引數旋轉它們。
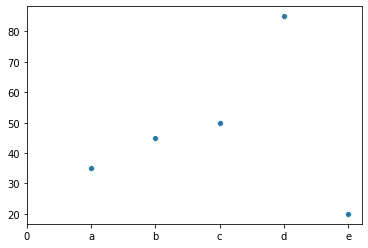
例如,
import seaborn as sns
import matplotlib.pyplot as plt
import pandas as pd

s_x = [1, 2, 3, 4, 5]
s_y = random.sample(range(0, 100), 5)

df = pd.DataFrame({"s_x": s_x, "s_y": s_y})

g = sns.scatterplot(data=df, y=s_y, x=s_x)
g.set_xticks(range(len(s_x) + 1))
g.set_xticklabels(["0", "a", "b", "c", "d", "e"])
同樣,set_yticklabels() 可用於自定義 y 軸刻度標籤。
請注意,此函式用於繪圖的軸物件。
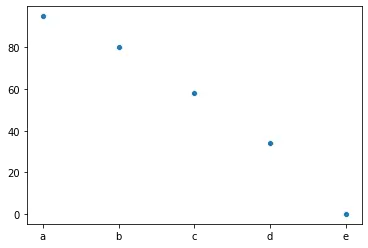
在 Python 中使用 matplotlib.pyplot.xticks() 和 matplotlib.pyplot.yticks() 函式設定 Seaborn 圖上的軸刻度標籤
這些功能可用於多種用途。如果我們不帶引數使用它們,它們將返回軸上預設刻度標籤的位置和標籤值。但是,如果我們使用位置和標籤值指定它們,我們可以使用它們來設定自定義刻度值。
有關 xticks() 函式的使用,請參考以下程式碼。
import seaborn as sns
import matplotlib.pyplot as plt
import pandas as pd

s_x = [1, 2, 3, 4, 5]
s_y = random.sample(range(0, 100), 5)

df = pd.DataFrame({"s_x": s_x, "s_y": s_y})

g = sns.scatterplot(data=df, y=s_y, x=s_x)
plt.xticks([1, 2, 3, 4, 5], ["a", "b", "c", "d", "e"])
同樣,yticks() 可用於自定義 y 軸刻度標籤。在這裡,我們也可以使用不同的引數來控制刻度值的大小和旋轉。
此外,可以使用 get_xticklabels() 或 get_yticklabels() 來獲取預設刻度值。
Enjoying our tutorials? Subscribe to DelftStack on YouTube to support us in creating more high-quality video guides. Subscribe
作者: Manav Narula

Manav is a IT Professional who has a lot of experience as a core developer in many live projects. He is an avid learner who enjoys learning new things and sharing his findings whenever possible.
LinkedIn