How to Debug TypeScript Files in Visual Studio Code
This tutorial provides a brief demonstration with the example of Debugging TypeScript Files in Visual Studio Code and gives us an understanding of Debug and why Debugging in any programming language is too important with advantages.
The Advantages of Debugging
Debugging in computer programming can be defined as a multistep process that involves isolating the source of the problem, identifying a problem, and then correcting the problem. After the Debugging is complete, the final step is to test the correction or workaround to ensure it works.
The Following are some listed advantages of Debugging.
- It helps in Identifying the Error.
- It helps in Analyzing the Error.
- It helps in Finding the Error.
- It helps in Fixing and Validating the Error.
- It helps in covering the Lateral Damage.
Debugging TypeScript File in Visual Studio Code
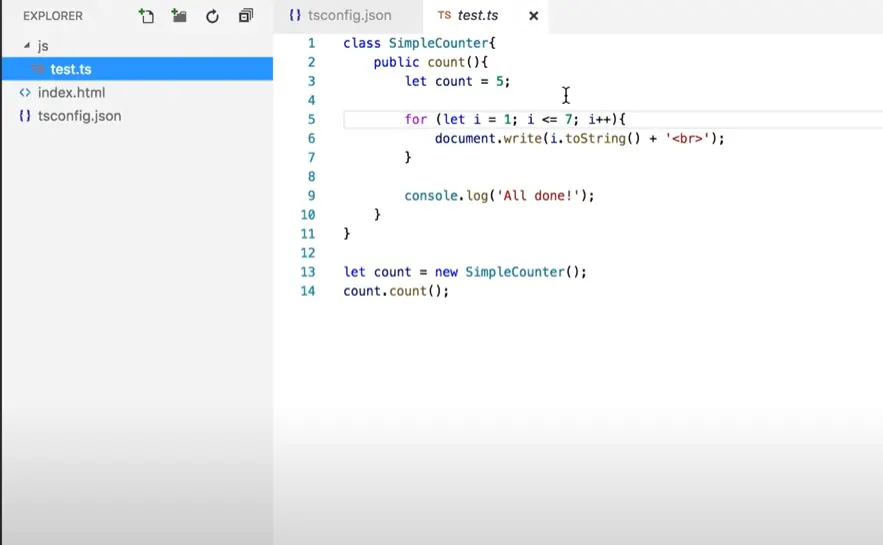
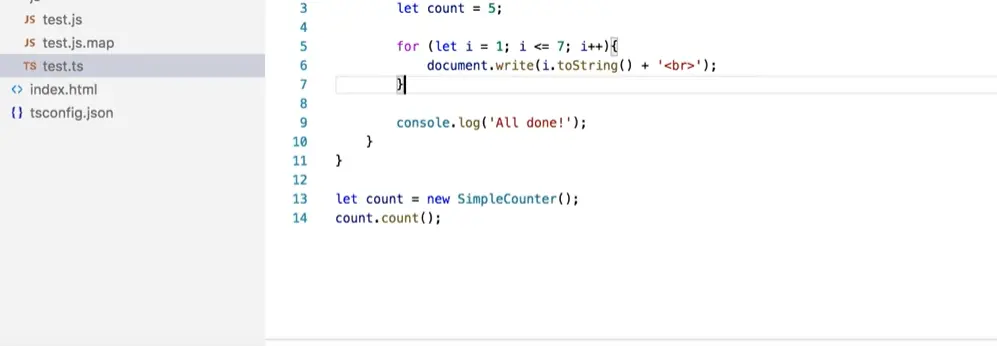
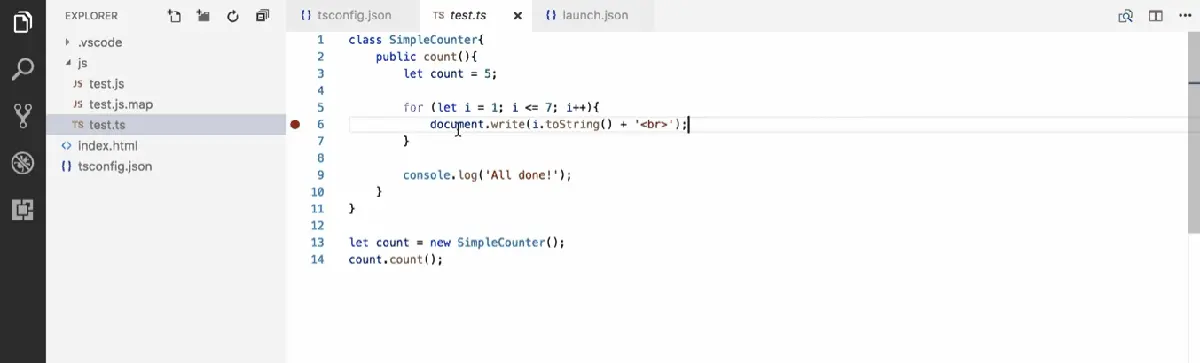
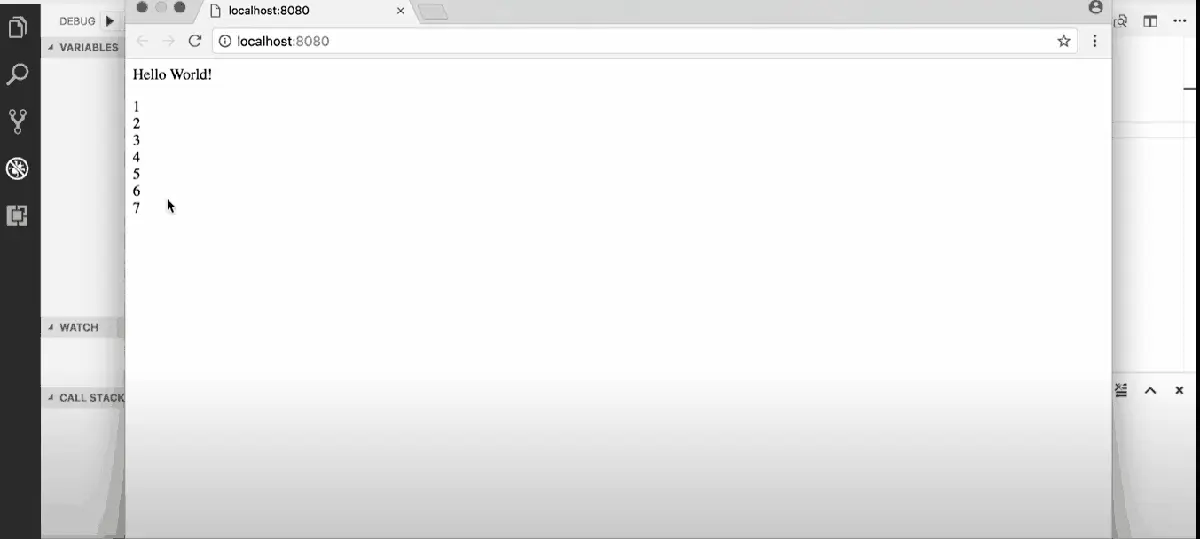
Consider the following lines of code in the TypeScript file, which inserts the loop count into the document. This TypeScript file is finally compiled into a JavaScript file as the browser engine does not understand TypeScript.
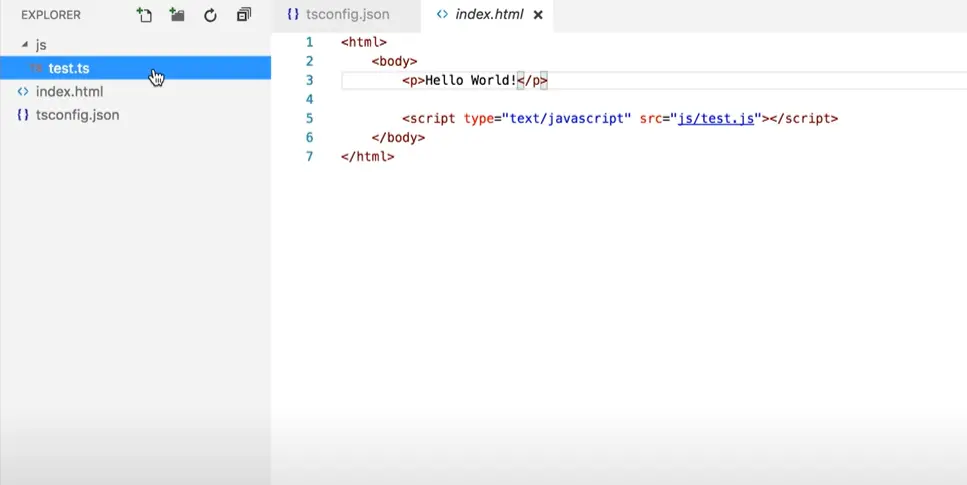
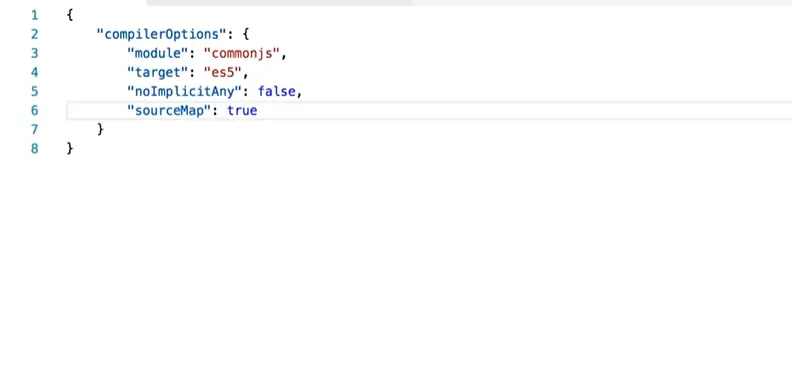
The JavaScript File is linked to the index.html file. In the tsconfig.json file, the sourceMap is set to true so the browser will consider the compiled JavaScript code.
test.js. Code:
class SimpleCounter{
    public count(){
        let count=5;
        for(let i=0;i<=7;i++){
            document.write(i.toString()+'<br>');
        }
        console.log("All done!");
    }
}
let count = new SimpleCounter();
count.count();
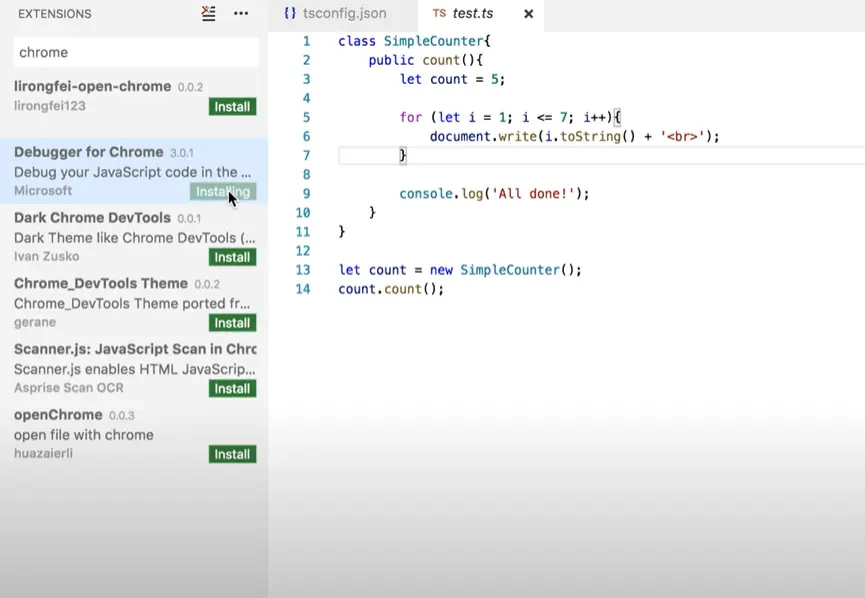
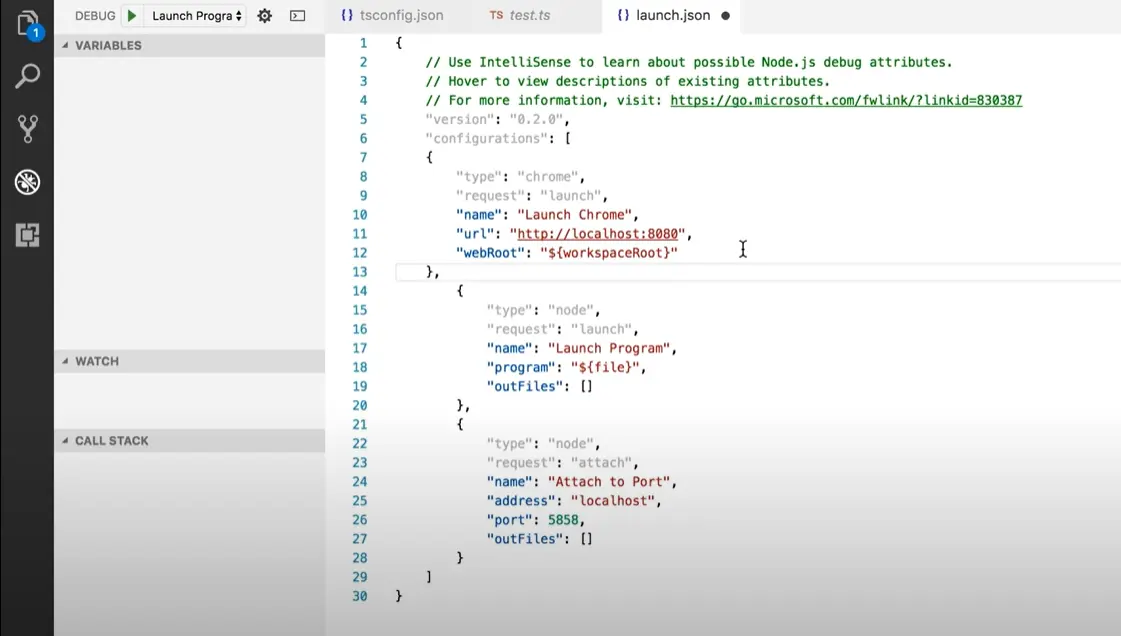
After setting everything up there, we move towards installing the Debugger for Chrome extension from the Visual Studio Code extension option, which will create an instance for the debug mode when it is launched in the respective browser for which the extension is being installed.
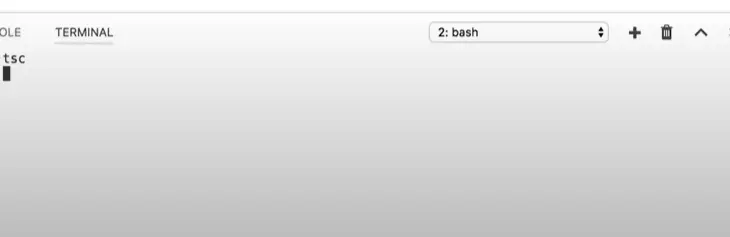
In the launch.json file, set the url path to the desired port number on which you want to create an instance when the debugger is launched. After everything is done, enter tsc in the terminal to compile the TypeScript into JavaScript so the browser can understand it.
For enabling the Debug mode in Visual Studio code, select the option to launch with Chrome and click the play button. This will create the chrome instance for the code.
For Debugging each step, you have to click the reload option, which will allow iterating through every step and shows the value of the variable in the Variables window. You can jump to every step by using the down and up arrows available in the bar.

Ibrahim is a Full Stack developer working as a Software Engineer in a reputable international organization. He has work experience in technologies stack like MERN and Spring Boot. He is an enthusiastic JavaScript lover who loves to provide and share research-based solutions to problems. He loves problem-solving and loves to write solutions of those problems with implemented solutions.
LinkedIn