Python Two-Sample T-Test

Most programmers around the world use Python language for programming. Python is very popular as an interpreted and high-level programming language.
Since most programmers use Python in object-oriented programming, people use it in web development, data visualization, sectors like Artificial Intelligence and Machine Learning, backend development and as a scripting language.
One feature that Python gives us is we can perform two-sample t-tests. Through this article, we will discuss what a two-sample t-test is and how to perform it using Python.
Two-Sample T-Test in Python
Two sample t-test is a type of test that we can do to determine whether the two unknown population means of two data groups are equal or not. It is also called the independent samples t-test.
It must not have any bearings for one group on another data group.
Before performing the two-sample t-test, we must consider three assumptions about the data groups.
- The two data groups we take to test are independent.
- Homogeneity assumption: Here, we assume that the two data groups have the same variances.
- The last assumption is whether the data distribution in data groups is different.
With these assumptions, we can perform a two-sample t-test.
We can take two hypotheses when analyzing the results of the two-sample t-test.
H0-dataGroup1 population mean = dataGroup2 population mean. Also known as the null hypothesis.HA-dataGroup1 population mean != dataGroup2 population mean.
There are three main methods to perform this test.
- Using
scipy - Using
pingouin - Using
statsmodels
Use SciPy Library
The SciPy, also known as the Scientific Python library, is an open-source Python library that solves scientific and mathematical problems. Several high-level Python commands are available for manipulating and visualizing data in the SciPy library.
Several sub-packages come under the SciPy library. Some of them are:
scipy.stats- Can use for statistics and random numbers.scipy.io- Can use for file input and output.scipy.linalg- Can use for linear algebra operations.scipy.signal- Can use for signal processing.
To perform a two-sample t-test, we can use this SciPy library.
The syntax for the two-sample t-test is below.
ttest_ind(dataGroup1, dataGroup2, equal_var=True / False)
Here the ttest_ind is a function provided by the scipy.stats sub-package where we perform the test. Inside it, we have dataGroup1 and dataGroup2, the data groups we create.
If equal_var equals true, the two-sample t-test will be performed by considering the equal population variances. If it is false, there will be Welch’s t-test considering the population variances are not equal.
By default, the equal_var is true.
Check the Equality of the Data Group’s Variance
Before performing the test, we need to check whether the data groups have the same variance. If we get a ratio of the large data group to the small data group below 4:1, we can say both data groups have equal variance.
To check it, we can use the below syntax.
np.var(dataGroup1), np.var(dataGroup2)
Let’s perform a t-test using an example.
Imagine we have two sample data groups where each group contains the marks of 10 students for a certain subject. We need to clarify the students from the two groups have the same mean marks for the subject.
As the first step, we must install the SciPy and NumPy libraries using the pip command.
$ pip install scipy
$ pip install numpy
Then we should import the scipy.stats sub-library and NumPy to our environment. As mentioned above, scipy.stats will help us to do the test, while NumPy will help us to create the data groups.
We can import those two modules as follows.
import scipy.stats as stats
import numpy as np
Then we can create the two groups with some data as follows.
dataGroup1 = np.array([17, 16, 14, 19, 20, 21, 15, 13, 14, 12])
dataGroup2 = np.array([19, 19, 14, 17, 22, 24, 16, 18, 15, 13])
Firstly, we can check the equality of the variances of the data groups as follows.
print(np.var(dataGroup1), np.var(dataGroup2))
After running the code, we will get an output as shown in the below image.

As you can see, the ratio is 10.809/8.49, which is less than 4:1. So we can say that the variances of the data groups are equal.
Now let’s perform the test.
print(stats.ttest_ind(dataGroup1, dataGroup2, equal_var=True))
Output:

Here the p-value we got is 0.2889, which is greater than the alpha value, which is 0.05. Therefore we can state that the mean marks of the students from the two groups are not different, which is the null hypothesis (According to the two hypotheses we mentioned earlier).
Full code:
# Importing the libraries
import scipy.stats as stats
import numpy as np

# Defining the data groups
dataGroup1 = np.array([17, 16, 14, 19, 20, 21, 15, 13, 14, 12])
dataGroup2 = np.array([19, 19, 14, 17, 22, 24, 16, 18, 15, 13])

# Check the equality of the variances of the data groups
print(np.var(dataGroup1), np.var(dataGroup2))

# Executing the test
print(stats.ttest_ind(dataGroup1, dataGroup2, equal_var=True))
Use pingouin Library
Another way we can perform a two-sample t-test is by using the pingouin package. It is an open-source package based on NumPy and pandas with statistical features.
To use pingouin, we need to install it using the pip command.
$ pip install pingouin
Then we can use the below syntax to conduct the t-test.
ttest(dataGroup1, dataGroup2, correction=True / False)
Here the ttest function is provided by the pingouin package. dataGroup1 and dataGroup2 are the groups we take to test.
If the correction is true, the test will be conducted by considering the homogeneity assumption. If it is false, as earlier, it conducts Welch’s t-test, not considering the homogeneity assumption.
Let’s take the previous example to perform the t-test. Firstly, we can import the NumPy and pingouin packages.
import pingouin as pg
import numpy as np
Then we define the data groups.
dataGroup1 = np.array([17, 16, 14, 19, 20, 21, 15, 13, 14, 12])
dataGroup2 = np.array([19, 19, 14, 17, 22, 24, 16, 18, 15, 13])
Now we can do the test.
print(pg.ttest(dataGroup1, dataGroup2, correction=True))
Output:
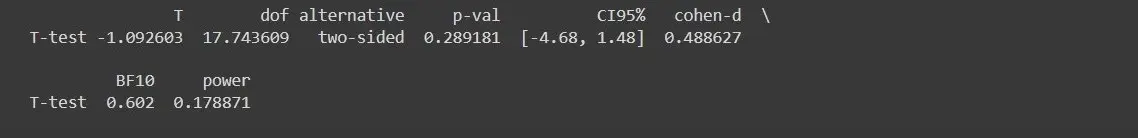
As you can see, we will have 0.2891 as the p-value, which is greater than the alpha value, which is 0.05. It determines that the mean marks of the two groups have no difference statistically.
Full code:
# Importing the libraries
import pingouin as pg
import numpy as np

# Defining the data groups
dataGroup1 = np.array([17, 16, 14, 19, 20, 21, 15, 13, 14, 12])
dataGroup2 = np.array([19, 19, 14, 17, 22, 24, 16, 18, 15, 13])

# Executing the test
print(pg.ttest(dataGroup1, dataGroup2, correction=True))
Use statsmodels Module
Statsmodels is a Python module built based on SciPy, NumPy and Matplotlib. It gives users functions and classes to perform statistical tests and estimations.
We can conduct two-sample t-tests using the statsmodels module as well. We should install the module using the pip command to use this.
$ pip install statsmodels
We can use the below syntax to conduct t-tests.
ttest_ind(dataGroup1, dataGroup2)
ttest_ind is the function we use to conduct the test, and dataGroup1 and dataGroup2 are the groups we take to test.
Let’s try the testing using the previous example.
First, we need to import the ttest_ind function from the statsmodels. Then we can import the numpy library.
from statsmodels.stats.weightstats import ttest_ind
import numpy as np
Now, we can define the data groups as we did earlier.
dataGroup1 = np.array([17, 16, 14, 19, 20, 21, 15, 13, 14, 12])
dataGroup2 = np.array([19, 19, 14, 17, 22, 24, 16, 18, 15, 13])
Then we can perform the test below.
print(ttest_ind(dataGroup1, dataGroup2))
Output:

As you can see, we received 0.2889 as the p-value, which is greater than the alpha value. Therefore we can say the mean marks of the student groups are not statistically different from others.
Full code:
# Importing libraries
from statsmodels.stats.weightstats import ttest_ind
import numpy as np

# Definig the data groups
dataGroup1 = np.array([17, 16, 14, 19, 20, 21, 15, 13, 14, 12])
dataGroup2 = np.array([19, 19, 14, 17, 22, 24, 16, 18, 15, 13])

# Executing the test
print(ttest_ind(dataGroup1, dataGroup2))
Conclusion
Through this article, we discussed what a two-sample t-test is and how to conduct it in Python. As we learned, there are three main methods to do the test: using SciPy, pingouin and statsmodels.
Those three methods require different libraries and functions to do the testing.
We took an example to understand the concept and applied it to all the methods. Then we analyzed the results using the hypothesis and the assumptions.

Nimesha is a Full-stack Software Engineer for more than five years, he loves technology, as technology has the power to solve our many problems within just a minute. He have been contributing to various projects over the last 5+ years and working with almost all the so-called 03 tiers(DB, M-Tier, and Client). Recently, he has started working with DevOps technologies such as Azure administration, Kubernetes, Terraform automation, and Bash scripting as well.