How to Implement a High Pass Filter Using Python

A High Pass Filter is a filter that restricts the movement of signals that are lower than a predefined threshold frequency or a cutoff. The signal with frequencies more than or equal to the threshold passes through the filter unobstructed. This action attenuates signals with low frequencies. A high pass filter filters out unwanted noises such as sounds.
In this article, we will learn how to implement a high pass filter using Python.
Implement High Pass Filter Using Python
The implementation of the high pass filter uses 4 Python modules, namely, numpy, pandas, scipy, and matplotlib.
The numpy module is a robust Python module that is rich with utilities for working with large multi-dimensional matrices and arrays. These utilities help perform both complex and straightforward mathematical operations over matrices seamlessly. These utilities are optimised and highly dynamic to the inputs.
To install the latest version of the numpy module, use either of the following pip commands.
pip install numpy
pip3 install numpy
The pandas module is a powerful and flexible open-source data analysis and data manipulation module written in Python.
To install the pandas module, use either of the following pip commands.
pip install pandas
pip3 install pandas
The scipy module is an open-source Python module for scientific and technical computing.
To install the scipy module, use either of the following pip commands.
pip install scipy
pip3 install scipy
And, the matplotlib module is a comprehensive and optimized Python library for graphical visualization of data.
To install the latest version of the matplotlib module, use either of the following pip commands.
pip install matplotlib
pip3 install matplotlib
Now that we are done with brief introductions about the libraries, let us look at the Python code for the high pass filter.
import numpy as np
import pandas as pd
from scipy import signal
import matplotlib.pyplot as plt


def sine_generator(fs, sinefreq, duration):
    T = duration
    n = fs * T
    w = 2.0 * np.pi * sinefreq
    t_sine = np.linspace(0, T, n, endpoint=False)
    y_sine = np.sin(w * t_sine)
    result = pd.DataFrame({"data": y_sine}, index=t_sine)
    return result


def butter_highpass(cutoff, fs, order=5):
    nyq = 0.5 * fs
    normal_cutoff = cutoff / nyq
    b, a = signal.butter(order, normal_cutoff, btype="high", analog=False)
    return b, a


def butter_highpass_filter(data, cutoff, fs, order=5):
    b, a = butter_highpass(cutoff, fs, order=order)
    y = signal.filtfilt(b, a, data)
    return y


fps = 30
sine_fq = 10
duration = 10
sine_5Hz = sine_generator(fps, sine_fq, duration)
sine_fq = 1
duration = 10
sine_1Hz = sine_generator(fps, sine_fq, duration)
sine = sine_5Hz + sine_1Hz
filtered_sine = butter_highpass_filter(sine.data, 10, fps)
plt.figure(figsize=(20, 10))
plt.subplot(211)
plt.plot(range(len(sine)), sine)
plt.title("Generated Signal")
plt.subplot(212)
plt.plot(range(len(filtered_sine)), filtered_sine)
plt.title("Filtered Signal")
plt.show()
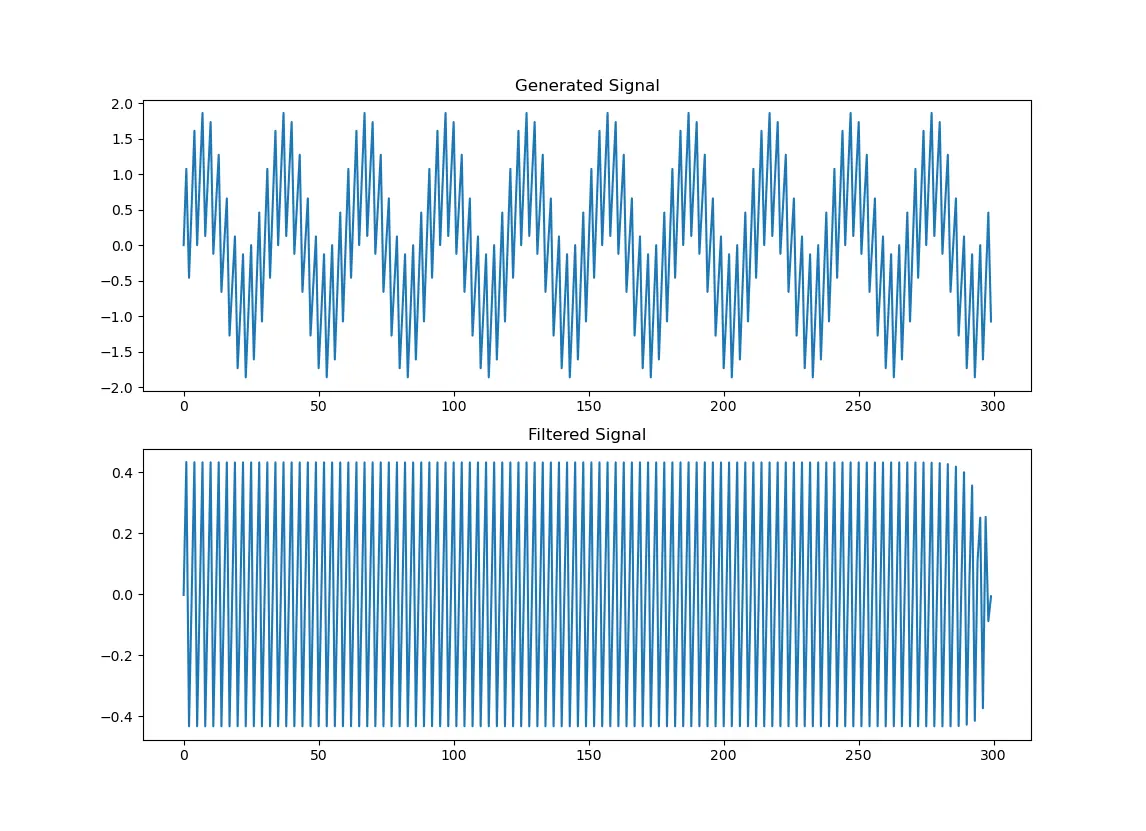
In the above code, the sine frequency or the sine_fq value should be in Hertz or Hz, and the duration or duration should be in seconds or sec. The generated signal is the original signal, and the filtered signal is the signal formed due to the high pass filter. The graph generated shows the differences between the two.

Vaibhav is an artificial intelligence and cloud computing stan. He likes to build end-to-end full-stack web and mobile applications. Besides computer science and technology, he loves playing cricket and badminton, going on bike rides, and doodling.