Pandas value_counts Percentage
-
Use Pandas
value_counts()Function to Count Values From Dataframe in Python -
Apply the
value_counts()Function on List of Columns - Convert Frequency Into Percentage in Python

We will learn how to use the value_counts() function to count values and see how to apply this function to a list of dataframe columns. We will also learn how to convert frequencies into percentages in Python.
Use Pandas value_counts() Function to Count Values From Dataframe in Python
The value_counts() function operates a little bit similar to groupby() function but there are also advantages of using value_counts() function.
To explore this Pandas function, we use an employee data set for our analysis and will find the percentage of employees in each department.
The goal is to create a simple dataframe of salaries and find the top segment of employees by salary in the department and what departments are left by employees. And we are going to turn frequency into a percentage; all of this can be done with the value_counts() function.
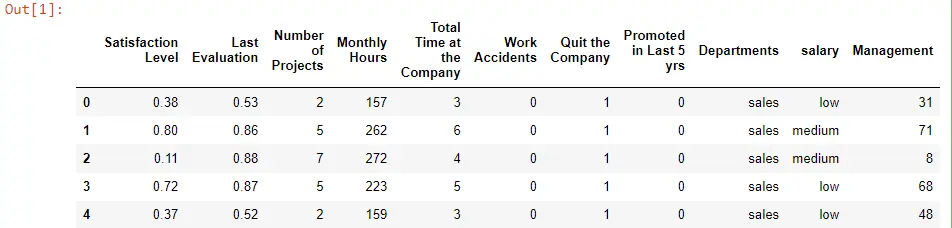
Let’s get started by importing Pandas and saving it as pd, which is our variable, and then we use the pd variable to call the read_csv() function and pass our data file called HR_file.csv.
We have access to the head() function, which gives us the first five rows and a few columns.
import pandas as pd

Employee_Data = pd.read_csv("HR_file.csv")
Employee_Data.head()
We can always isolate a column we are interested in by using a square bracket, and inside the brackets, we are going to call the salary column. Now we are going to use the value_counts() function.
Employee_Data["salary"].value_counts()
We can see the low, medium, and high distribution of salaries.
low       7316
medium    6446
high      1237
Name: salary, dtype: int64
the normalize Parameter
We can always see what this function requires by pressing Shift+Tab, and we can see there are some different parameters we can use, for example, normalize.
We can see that the vast majority of our salaries are in a low category, but if we wanted to get a percentage, we would use normalize equals True.
Employee_Data["salary"].value_counts(normalize=True)
Output:
low       0.487766
medium    0.429762
high      0.082472
Name: salary, dtype: float64
We can easily change the salary column with the Departments column.
Employee_Data["Departments "].value_counts(normalize=True)
We can see the breakdown of departments, and we still have that normalized.
sales          0.276018
technical      0.181345
support        0.148610
IT             0.081805
product_mng    0.060137
marketing      0.057204
RandD          0.052470
accounting     0.051137
hr             0.049270
management     0.042003
Name: Departments , dtype: float64
If we did not want that normalized, we would get rid of that, which will display in descending order.
Employee_Data["Departments "].value_counts()
Output:
sales          4140
technical      2720
support        2229
IT             1227
product_mng     902
marketing       858
RandD           787
accounting      767
hr              739
management      630
Name: Departments , dtype: int64
Apply the value_counts() Function on List of Columns
The next thing we can do is what is the intersection between employees by salary and Departments . We will use more than one column by using a list, and inside the list, we will pass salary and Departments and then apply the value_counts() function to it.
If you see a little space in front of Departments , it is because the department adds a space after it for some reason, so we will add a space using this column.
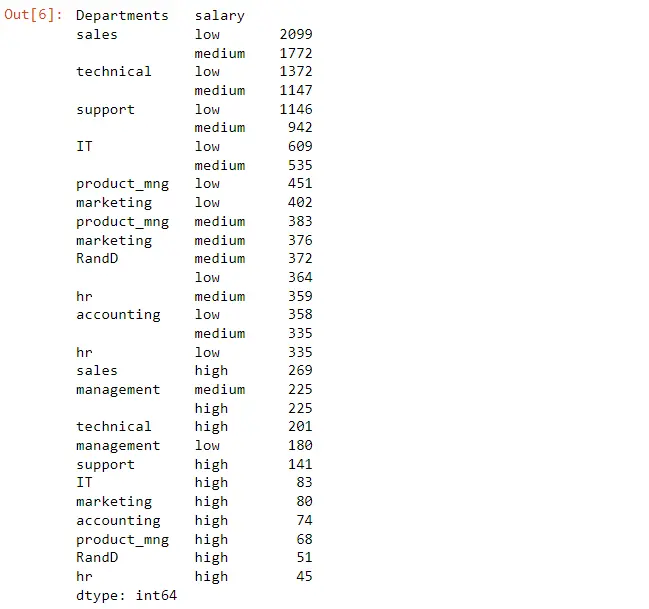
Employee_Data[["Departments ", "salary"]].value_counts()
We can see most of our employee’s sales and the majority of those are in the low range and then if we come down here we can see there is a high salary amount in sales but only 269 people. And 2099 is in a low salary range.
Convert Frequency Into Percentage in Python
Now we want to know what departments are left by employees. We will use the Quit the Company column to do this.
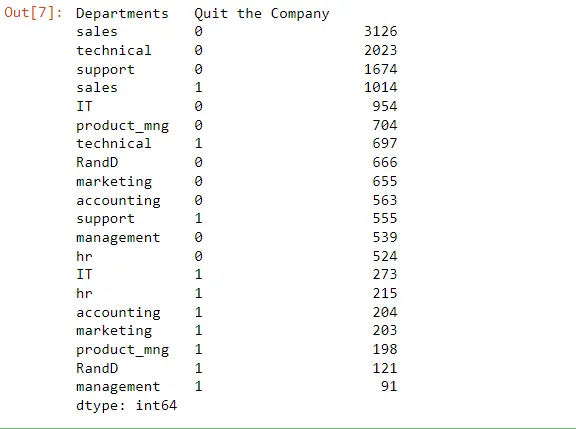
Employee_Data[["Departments ", "Quit the Company"]].value_counts()
As we see, 1 is where in terms of who quit the company, so we would only be looking at the ones. The majority of people left the sales department.
Now we only need to evaluate sales; we could easily isolate our Departments column by creating a condition and getting a mask.
Employee_Data["Departments "] == "sales"
Now we will encapsulate this condition into brackets and store it in a variable called sales. Using sales, we are looking at the value counts of those who quit the company.
sales = Employee_Data[Employee_Data["Departments "] == "sales"]
sales["Quit the Company"].value_counts()
Now we can see the number who have quit the company.
0    3126
1    1014
Name: Quit the Company, dtype: int64
It may be good to see this in a percentage.
sales = Employee_Data[Employee_Data["Departments "] == "sales"]
sales["Quit the Company"].value_counts(normalize=True)
Output:
0    0.755072
1    0.244928
Name: Quit the Company, dtype: float64

Hello! I am Salman Bin Mehmood(Baum), a software developer and I help organizations, address complex problems. My expertise lies within back-end, data science and machine learning. I am a lifelong learner, currently working on metaverse, and enrolled in a course building an AI application with python. I love solving problems and developing bug-free software for people. I write content related to python and hot Technologies.
LinkedIn