How to Calculate the Rolling Standard Deviation in Pandas
-
Deprecated the
rolling_std()Function to Calculate the Rolling Standard Deviation -
Use the
rolling()Function to Calculate the Rolling Standard Deviation
Statistics is a big part of data analysis, and using different statistical tools reveals useful information. Python and Pandas allow us to quickly use functions to obtain important statistical values from mean to standard deviation.
This article will discuss how to calculate the rolling standard deviation in Pandas.
Deprecated the rolling_std() Function to Calculate the Rolling Standard Deviation
Standard deviation is the square root of the variance, but over a moving timeframe, we need a more comprehensive tool called the rolling standard deviation (or moving standard deviation). With rolling standard deviation, we can obtain a measurement of the movement (volatility) of the data within the moving timeframe, which serves as a confirming indicator.
Previously, and more likely in legacy statistical code, to calculate rolling standard deviation, you will see the use of the Pandas rolling_std() function, which was previously used to make said calculation. However, after pandas 0.19.0, to calculate the rolling standard deviation, we need the rolling() function, which covers all the rolling window calculations from means to standard deviations.
Use the rolling() Function to Calculate the Rolling Standard Deviation
With the rolling() function, we don’t need a specific function for rolling standard deviation. We have to use the rolling() function to obtain the rolling windows calculations for a dataset and apply the popular statistical functions, such as mean, std, etc., to achieve our rolling (or moving) statistical values.
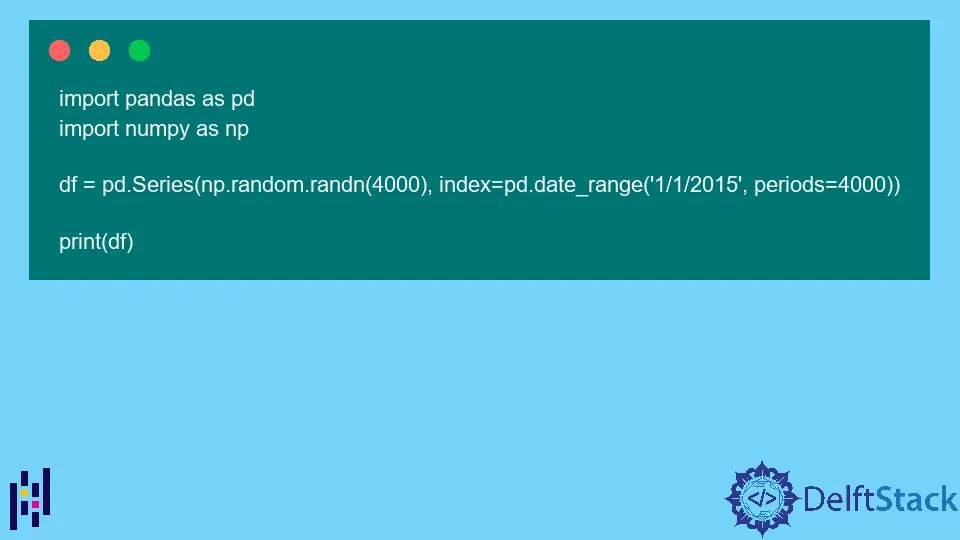
To illustrate, we will create a randomized time series (from 2015 to 2025) using the numpy library.
Code:
import pandas as pd
import numpy as np

df = pd.Series(np.random.randn(4000), index=pd.date_range("1/1/2015", periods=4000))

print(df)
Output:
2015-01-01   -0.143644
2015-01-02   -1.035695
2015-01-03    0.338760
2015-01-04   -0.002474
2015-01-05   -1.598976
                ...
2025-12-09    1.227600
2025-12-10   -1.188466
2025-12-11   -0.740481
2025-12-12   -0.674217
2025-12-13   -1.089239
Freq: D, Length: 4000, dtype: float64
Then, use the rolling() function on the DataFrame, after which we apply the std() function on the rolling() return value.
print(df.rolling(window=60).std())
Output:
2015-01-01         NaN
2015-01-02         NaN
2015-01-03         NaN
2015-01-04         NaN
2015-01-05         NaN
                ...
2025-12-09    0.889344
2025-12-10    0.902873
2025-12-11    0.894309
2025-12-12    0.898170
2025-12-13    0.894943
Freq: D, Length: 4000, dtype: float64
Now, we have the rolling standard deviation of the randomized dataset we developed.

Olorunfemi is a lover of technology and computers. In addition, I write technology and coding content for developers and hobbyists. When not working, I learn to design, among other things.
LinkedIn