How to Implement OLS Regression in Pandas
OLS regression, or Ordinary Least Squares regression, is essentially a way of estimating the value of the coefficients of linear regression equations. This method reduces the sum of the squared differences between the actual and predicted values of the data.
In this article, we will explore how we can apply OLS regression techniques with the help of the Pandas Data Frame in Python.
Pandas Data Frames
The Pandas library in Python provides various tools and technologies to manipulate and analyze data. Data frames are one such tool.
A data frame in Pandas is essentially a two-dimensional data structure with corresponding labels. It is a structure that stores data in a tabular form.
For us to be able to perform an OLS regression technique on a DataFrame, we will first need to create a test DataFrame. The way to do this is very straightforward indeed.
First, we cover the installation of all our prerequisite libraries. In this case, it is Pandas and statsmodels.
pip install pandas
pip install statsmodels
We run the commands above in the terminal of our choice, and it will install the Pandas and statsmodels modules if they are not already installed.
That is pretty much it on the installation of the prerequisites front. Now we can begin creating our dataframe.
The following dataframe contains the following:
- The names of students.
- The countries they belong to.
- Their grades in three subjects out of 100.
Example Code:
import pandas as pd

data = {
    "Student_Name": ["Anil", "Suharwardy", "Fatina", "John", "Karen"],
    "Country": ["India", "India", "Pakistan", "America", "America"],
    "Biology": [68, 73, 87, 58, 78],
    "Physics": [83, 53, 93, 87, 78],
    "Chemistry": [78, 98, 89, 73, 87],
}
data_frame = pd.DataFrame(data=data)
print(data_frame)
Output:
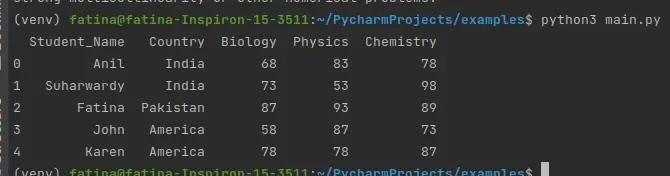
It is important to note that we must use data with eight or more values for professional and accurate OLS regression results. We shortened the list for this article so that it would be easier to follow.
Run an OLS Regression on Pandas DataFrame
Now that we have our data frame, let’s understand the approach we are to follow. Using the OLS regression techniques and methods, we will be predicting the results for the student’s marks in Biology using their marks in Physics and Chemistry.
We will use this technique’s statsmodels module to perform the OLS operations on our defined data frame. Look at the code below to observe how we achieve this.
import pandas as pd
import statsmodels.formula.api as sm
data = {
"Student_Name": ["Anil", "Suharwardy", "Fatina", "John", "Karen"],
"Country": ["India", "India", "Pakistan", "America", "America"],
"Biology": [68, 73, 87, 58, 78],
"Physics": [83, 53, 93, 87, 78],
"Chemistry": [78, 98, 89, 73, 87],
}
data_frame = pd.DataFrame(data=data)
response = sm.ols(formula="Biology~Physics+Chemistry", data=data_frame).fit()
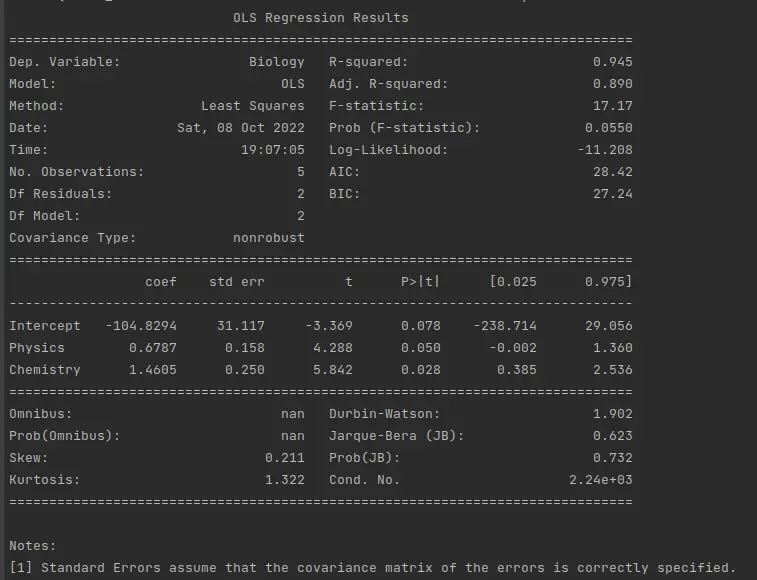
print(response.summary())
Output:
As observed, we derive a formula for predicting the Biology marks, feed it to the ols() method, and later print the summary of the results.
This is how we can use the statsmodels and Pandas libraries to perform a straightforward OLS regression operation on a Pandas dataframe. Hope you enjoyed the read!

I am Fariba Laiq from Pakistan. An android app developer, technical content writer, and coding instructor. Writing has always been one of my passions. I love to learn, implement and convey my knowledge to others.
LinkedIn