How to Calculate Percentage Change in Pandas
-
Use
pct_change()to Calculate Percentage Change in Pandas - Fill Missing Values Before Calculating the Percentage Change in Pandas
-
Calculate Percentage Change for
Multi-IndexDataFrame in Pandas

The pct_change() is a function in Pandas that calculates the percentage change between the elements from its previous row by default. In the case of time series data, this function is frequently used.
The output of this function is a data frame consisting of percentage change values from the previous row. We can specify other rows to compare as arguments when we call this function.
It works on the following formula.
Use pct_change() to Calculate Percentage Change in Pandas
This method accepts four optional arguments, which are below.
periods- having default value1. It specifies the periods to shift to calculate the percent change.fill_method- Specifies how to handle NAs before calculating the percentage change.limit- Specifies the amount of consecutive NAs to fill before stopping.freq- Increment to use from time series API (e.g.'M'orBDay()).
The following is a simple code to calculate the percentage change between two rows. We will call the pct_change() method with the data frame object without passing any arguments.
# Python 3.x
import pandas as pd

df = pd.DataFrame([[2, 4, 6], [1, 2, 3], [5, 7, 9]])
print(df.pct_change())
Output:

Fill Missing Values Before Calculating the Percentage Change in Pandas
For example, we have missing or None values in the data frame. When calculating the percentage change, the missing data will be filled by the corresponding value in the previous row.
Here, ffill means forward fill.
# Python 3.x
import pandas as pd

df = pd.DataFrame([[2, 4, 6], [1, None, 3], [None, 7, 9]])
print(df.pct_change(fill_method="ffill"))

Calculate Percentage Change for Multi-Index DataFrame in Pandas
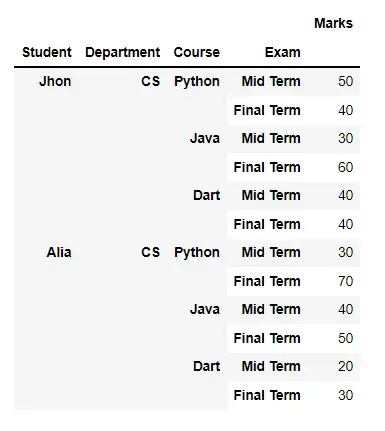
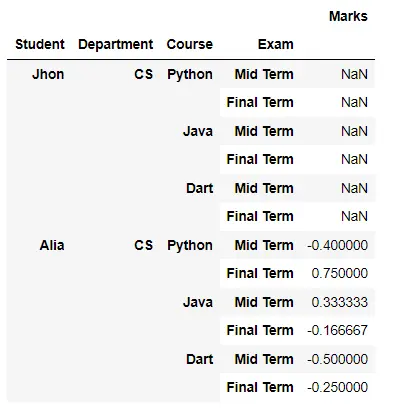
We can also calculate percentage change for multi-index data frames. We can split the data into groups according to some criteria using the groupby() method then apply the pct_change().
# Python 3.x
df = pd.DataFrame(
    index=pd.MultiIndex.from_product(
        [
            ["Jhon", "Alia"],
            ["CS"],
            ["Python", "Java", "Dart"],
            ["Mid Term", "Final Term"],
        ],
        names=["Student", "Department", "Course", "Exam"],
    ),
    data={"Marks": [50, 40, 30, 60, 40, 40, 30, 70, 40, 50, 20, 30]},
)
print(df)
print(df.groupby(level=[1, 2, 3]).pct_change())
Output:


I am Fariba Laiq from Pakistan. An android app developer, technical content writer, and coding instructor. Writing has always been one of my passions. I love to learn, implement and convey my knowledge to others.
LinkedIn