How to Visualize KDE Plot With Pandas and Seaborn
- Data Visualization Using Normal KDE Plot and Seaborn in Python
- One-Dimensional KDE Plot Using Pandas and Seaborn in Python
- Two-Dimensional or Bivariate KDE Plot Using Pandas and Seaborn in Python
- Conclusion
KDE is Kernel Density Estimate, used to visualize the probability density of continuous and non-parametric data variables. When you want to visualize the multiple distributions, the KDE function produces a less cluttered plot that is more interpretable.
Using KDE, we can visualize multiple data samples using a single graph plot, which is a more efficient method in data visualization.
Seaborn is a python library like matplotlib. Seaborn can be integrated with pandas and numpy for data representations.
Data scientists use this library to create informative and beautiful statistical charts and graphs. Using these presentations, you can understand the clear concepts and flow of information within different modules.
We can plot univariate and bivariate graphs using the KDE function, Seaborn, and Pandas.
We will learn about the KDE plot visualization with pandas and seaborn. This article will use a few samples of the mtcars dataset to show the KDE plot visualization.
Before starting with the details, you need to install or add the seaborn and sklearn libraries using the pip command.
pip install seaborn
pip install sklearn
Data Visualization Using Normal KDE Plot and Seaborn in Python
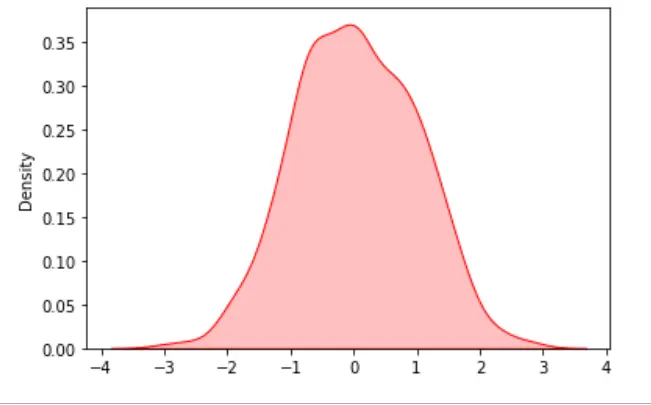
We can plot the data using the normal KDE plot function with the Seaborn library.
In the following example, we have created 1000 data samples using the random library then arranged them in the array of numpy because the Seaborn library only works well with numpy and Pandas dataframes.
Example Code:
import seaborn as sn
import matplotlib.pyplot as plt
import numpy as np

data = np.random.randn(1000)
# KDE Plot with seaborn
res = sn.kdeplot(data, color="red", shade="True")
plt.show()
Output:
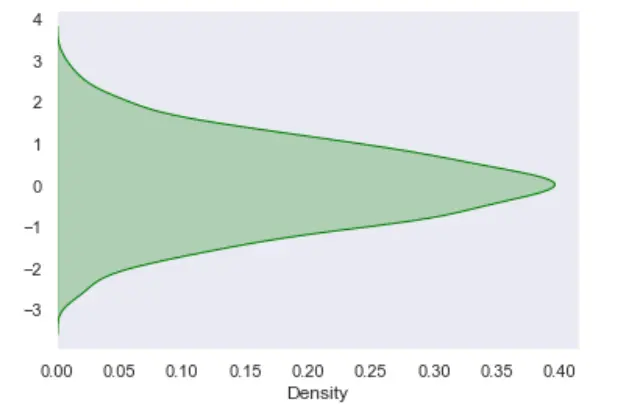
We can also visualize the above data sample vertically or revert the above plot using the KDE and Seaborn library. We used the plot property vertical=True to revert the above plot.
Example Code:
import seaborn as sn
import matplotlib.pyplot as plt
import numpy as np

data = np.random.randn(1000)
# KDE Plot with seaborn
res = sn.kdeplot(data, color="green", vertical=True, shade="True")
plt.show()
Output:
One-Dimensional KDE Plot Using Pandas and Seaborn in Python
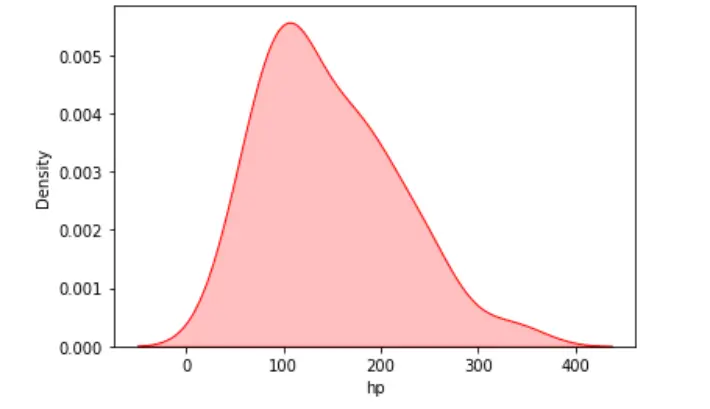
We can visualize the probability distribution for a single target or continuous attribute using the KDE plot. In the following example, we have read a CSV file of the mtcars dataset.
There are more than 350 entries in our dataset, and we will visualize the univariate distribution along the x-axis.
Example Code:
import seaborn as sn
import matplotlib.pyplot as plt
import numpy as np
import pandas as pd

# read CSV file of dataset using pandas
dataset = pd.read_csv(r"C:\\Users\\DELL\\OneDrive\\Desktop\\samplecardataset.csv")
# kde plot using seaborn
sn.kdeplot(data=dataset, x="hp", shade=True, color="red")
plt.show()
Output:
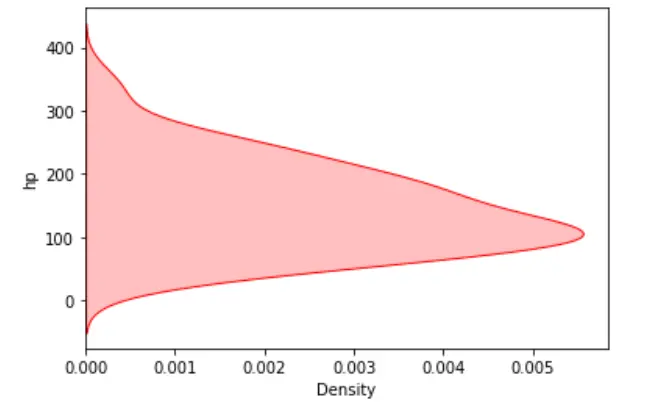
You can also flip the plot by visualizing the data variable along the y-axis.
Example Code:
import seaborn as sn
import matplotlib.pyplot as plt
import numpy as np
import pandas as pd

# Read CSV file using pandas
dataset = pd.read_csv(r"C:\\Users\\DELL\\OneDrive\\Desktop\\samplecardataset.csv")
# KDE plotting using seaborn
sn.kdeplot(data=dataset, y="hp", shade=True, color="red")
plt.show()
Output:
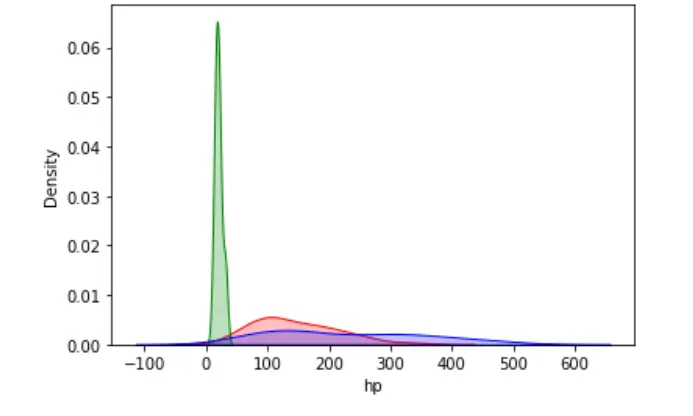
We can visualize the probability distribution of multiple target values in a single plot.
Example Code:
import seaborn as sn
import matplotlib.pyplot as plt
import numpy as np
import pandas as pd

# Read CSV file using pandas
dataset = pd.read_csv(r"C:\\Users\\DELL\\OneDrive\\Desktop\\samplecardataset.csv")
# KDE plotting using seaborn
sn.kdeplot(data=dataset, x="hp", shade=True, color="red")
sn.kdeplot(data=dataset, x="mpg", shade=True, color="green")
sn.kdeplot(data=dataset, x="disp", shade=True, color="blue")
plt.show()
Output:
Two-Dimensional or Bivariate KDE Plot Using Pandas and Seaborn in Python
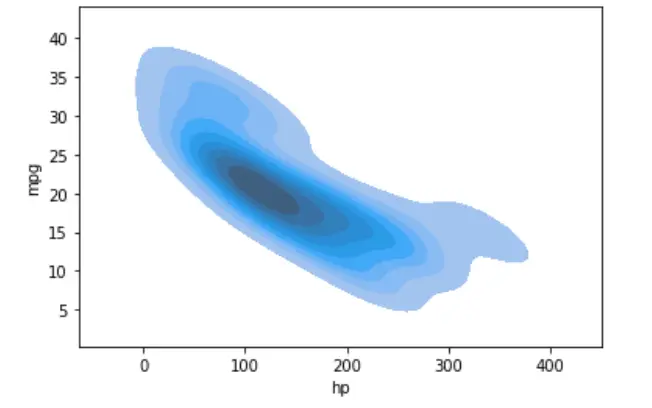
We can visualize data in two-dimensional or bivariate KDE plots using the seaborn and pandas library.
In this way, we can visualize the probability distribution of a given sample against multiple continuous attributes. We visualized the data along the x and y-axis.
Example Code:
import seaborn as sn
import matplotlib.pyplot as plt
import numpy as np
import pandas as pd

# Read CSV file using pandas
dataset = pd.read_csv(r"C:\\Users\\DELL\\OneDrive\\Desktop\\samplecardataset.csv")
# KDE plotting using seaborn
sn.kdeplot(data=dataset, shade=True, x="hp", y="mpg")
plt.show()
Output:
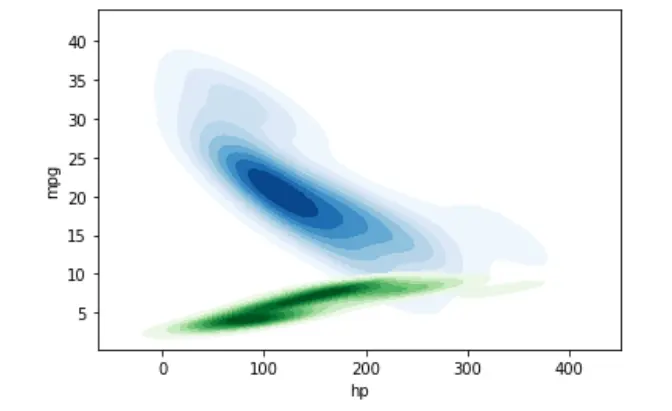
Similarly, we can plot the probability distribution of multiple samples using a single KDE plot.
Example Code:
import seaborn as sn
import matplotlib.pyplot as plt
import numpy as np
import pandas as pd

# Read CSV file using pandas
dataset = pd.read_csv(r"C:\\Users\\DELL\\OneDrive\\Desktop\\samplecardataset.csv")
# KDE plotting using seaborn
sn.kdeplot(data=dataset, shade=True, x="hp", y="mpg", cmap="Blues")
sn.kdeplot(data=dataset, shade=True, x="hp", y="cyl", cmap="Greens")
plt.show()
Output:
Conclusion
We demonstrated in this tutorial using the KDE plot visualization using Pandas and Seaborn library. We have seen how to visualize the probability distribution of single and multiple samples in a one-dimensional KDE plot.
We discussed how to use the KDE plot with Seaborn and Pandas to visualize the two-dimensional data.