How to Profile a PHP Script
This article will walk you through the process of profiling a PHP script using Xdebug.
Use Xdebug to Profile a Script in PHP
Xdebug is a popular PHP tool for debugging and profiling the PHP script. Profiling a script means analyzing the code to ensure it is optimized and has a high-level performance.
Profiling will provide information about the program’s CPU, memory and network utilization. The sections below will demonstrate how to set up the profiling environment and profile a sample script in PHP.
Install the Xdebug Tool
The first step is to download the Xdebug tool. Firstly, update your system using the following command.
sudo apt-get update
After updating the local packages, use the following command in the terminal to install the Xdebug tool.
sudo apt-get install php-xdebug
Next, navigate the path /etc/php/8.1/mods-available/xdebug.ini and open the xdebug.ini file. Here, 8.1 is the PHP version of the system used in the tutorial.
It may vary from user to user. Add the following lines in the xdebug.ini file.
zend_extension=/usr/lib/php/20210902/xdebug.so
xdebug.remote_autostart = 1
xdebug.remote_enable = 1
xdebug.remote_handler = dbgp
xdebug.remote_host = 127.0.0.1
xdebug.remote_log = /tmp/xdebug_remote.log
xdebug.remote_mode = req
xdebug.remote_port = 9005
Here, the directory 20210902 in the path /usr/lib/php/20210902/xdebug.so for the value of the zend_extension property may differ from system to system. Navigate to the path and use the correct directory name for the value of the zend_extension property.
Next, restart the web server using the following commands if the webserver is Apache.
sudo systemctl restart apache2
sudo /etc/init.d/apache2 restart
For nginx, use the following command.
sudo systemctl restart nginx
Finally, xdebug is installed in the system.
Configure php.ini to Use Xdebug
We can verify the installation of Xdebug in PHP by looking at the output of the phpinfo() function. But, the tool is not yet ready to be used.
We need to configure it in the php.ini file. For that, navigate to the php.ini file and open it with a text editor.
We can find the file’s path in the phpinfo() output. As of the current system, the file lies in the path /etc/php/8.1/apache2/php.ini.
In the php.ini file, add the following line at the end of the file.
[xdebug]
zend_extension=/usr/lib/php/20210902/xdebug.so
xdebug.show_local_vars=1
Rename the directory 20210902 with the directory used in your system. Next, set the display_errors and display_startup_errors properties to On and save the file.
Once again, restart the web server. Now, Xdebug is ready to be used.
Profile a PHP Script
The final step is to profile a PHP script. We need to write some PHP codes to profile it.
For example, create four variables $a, $b, $c and $d. Assign an integer value 5 and string value '5' in $a and $b.
Similarly, assign arrays array(5) and array('5') in $c and $d.
Next, use the var_dump() function to dump all four variables. At last, dump a variable $v again.
Note that we have not created any variable named $v.
Example Code:
$a=5;
$b='5';
$c=array(5);
$d=array('5');

var_dump($a);
var_dump($b);
var_dump($c);
var_dump($d);

var_dump($v);
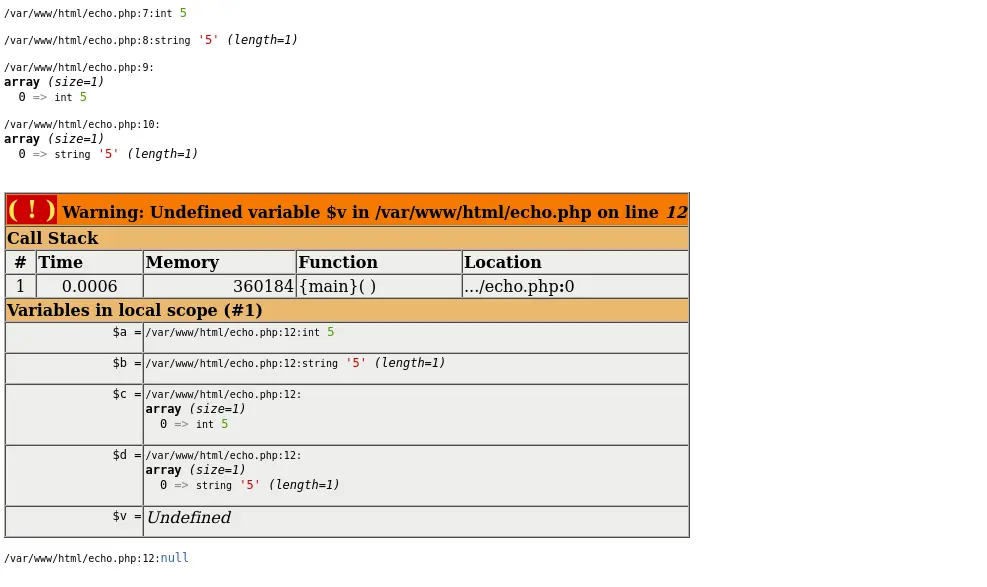
Output:
In the output section, the PHP script is profiled. The erroneous section of the code is highlighted.
It shows the information like Call Stack, where the information about time, memory, function and location are provided. Similarly, the information about the variable in local scope is also given.
In this way, we can use Xdebug to profile a PHP script.

Subodh is a proactive software engineer, specialized in fintech industry and a writer who loves to express his software development learnings and set of skills through blogs and articles.
LinkedIn