NumPy Correlation Function
- Correlation in NumPy
-
Use the
np.corrcoef()Function to Implement Correlation in Python - Use Correlation With the Matplotlib Library to Make Correlation Graphs
This tutorial demonstrates the correlation function np.corrcoef() function of the NumPy library in Python.
Correlation in NumPy
The correlation coefficient is a numbered value that indicates the relationship between the given features of the dataset.
Correlation can be either positive, meaning they have a direct relation, and an increase in one feature would lead to another. A negative correlation is also possible, suggesting that both the features have an inverse relationship with each other, meaning that a rise in one feature would lead to a fall in the other.
The following are some various correlations.
- Pearson’s correlation
- Kendall’s correlation
- Spearman’s correlation
However, the NumPy library function np.corrcoef() only focuses on and computes Pearson’s correlation value. The other correlations can be found using direct functions provided by the SciPy library.
This tutorial solely focuses on the np.coefcorr() function and its implementation.
Use the np.corrcoef() Function to Implement Correlation in Python
The np.corrcoef() function from the NumPy library is utilized to get a matrix of Pearson’s correlation coefficients between any two arrays, provided that both the arrays are of the same shape. This function generally returns a two-dimensional array, which depicts the correlation coefficients.
Import the NumPy library to the Python code to implement this function without facing any errors.
Example Code:
import numpy as np

a = np.arange(20, 30)
b = np.array([8, 12, 29, 33, 60, 48, 21, 44, 78, 96])
x = np.corrcoef(a, b)
print(x)
Output:
[[1.          0.82449488]
 [0.82449488  1.        ]]
The output matrix’s main diagonal always has all the values as one. In our case, the value of the upper-left element is one as it returns the correlation coefficient of x with x, and the lower right element returns the correlation coefficient of y with y.
The main values that need to be considered from the given output matrix are the other two values. This value comes out to be approximate 0.82 for our case. Moreover, both these elements always hold the same values.
Use Correlation With the Matplotlib Library to Make Correlation Graphs
The NumPy library can also be utilized alongside the Matplotlib library, enabling the user to have correlation graphs as the output. The following code uses the correlation function corrcoef() with the Matplotlib library to make correlation graphs.
Example Code:
import matplotlib.pyplot as plt
import matplotlib
import numpy as np
x = np.arange(20, 30)
y = np.array([8, 12, 29, 33, 60, 48, 21, 44, 78, 96])
print(np.corrcoef(x, y))
# %matplotlib inline
matplotlib.style.use("ggplot")
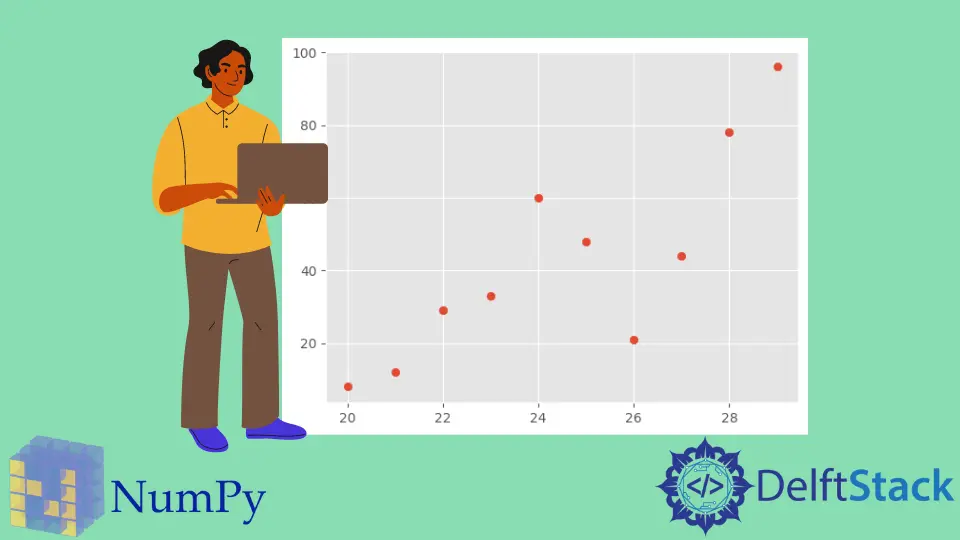
plt.scatter(x, y)
plt.show()
Output:
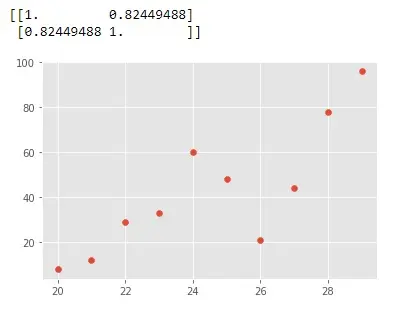
The above graph dictates a positive correlation as the graph seems to have a general upwards trajectory. This type of graph works even better for more number of elements in the given arrays.

Vaibhhav is an IT professional who has a strong-hold in Python programming and various projects under his belt. He has an eagerness to discover new things and is a quick learner.
LinkedIn