How to Log All Queries in MongoDB
-
the
getLogCommand in MongoDB - Levels of Verbosity for Logging Queries in MongoDB
- Log Slow Operations in MongoDB
-
Filter Results of the Log Queries Within
mongosh -
Filter Results of the Log Queries Outside
mongoshWithjq
In this article, you will learn about logging queries in MongoDB. Moreover, operators used for logging queries in MongoDB are explained in detail.
the getLog Command in MongoDB
The administrator command getLog retrieves the most recent 1024 logged mongod occurrences. The getLog command does not retrieve log data from the mongod log file; instead, it gets information from a RAM cache from logged mongod events.
Use the db.adminCommand() function to execute getLog. getLog delivers log data in escaped Relaxed Extended JSON v2.0 format beginning with MongoDB 4.4. Log data was previously delivered in plain text.
The syntax for the getLog command is as follows:
db.adminCommand( { getLog: <value> } )
The possible values for getLog are:
| Value | Description |
|---|---|
* |
Returns a list of the available values for the getLog command. |
global |
Returns the combined output of all log entries. |
startupwarnings |
Returns log entries from MongoDB’s log that may include errors or warnings from when the current process started. This filter might return an empty array if mongod was launched without signs. |
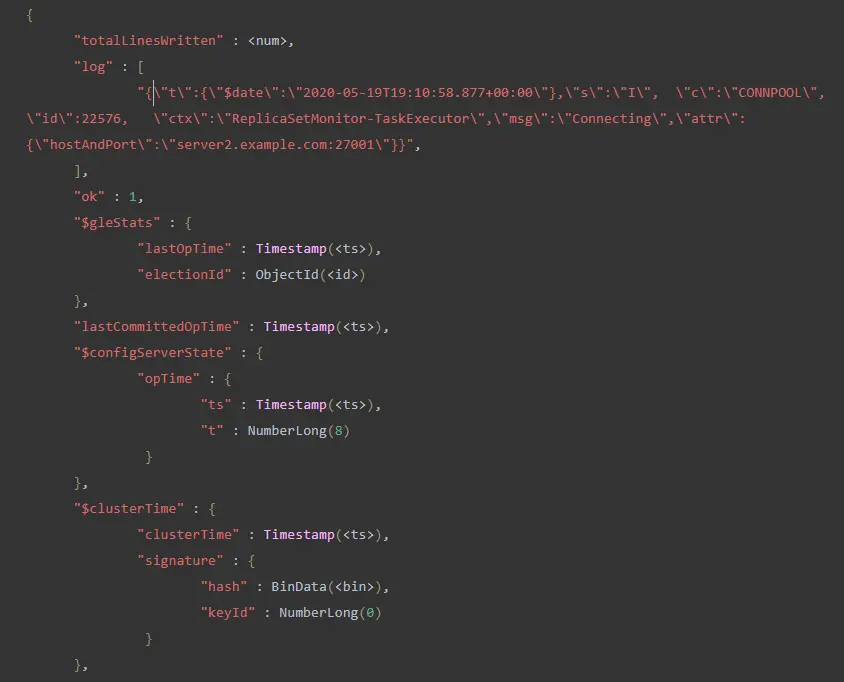
If * is supplied, the command returns a document containing the names of the other valid values. Otherwise, the command produces a document with the following fields:
- a
totalLinesWrittenfield containing the number of log events; logfield that contains an array of log events;- a response document providing status and timestamp information from
db.adminCommand().
Line Truncation Behavior of the getLog Command in MongoDB
Beginning with MongoDB 4.2, getLog truncates any event with more than 1024 characters. In previous versions, it truncates after 512 characters.
Character Evasion Behavior of the getLog Command in MongoDB
Beginning with MongoDB 4.4, getLog delivers log data in escaped Relaxed Extended JSON v2.0 format, utilizing the escape sequences listed below to transform log output as valid JSON:
| Character Represented | Escape Sequence |
|---|---|
Backslash (\) |
\\ |
Quotation Mark (") |
\" |
Formfeed (0x0C) |
\f |
Backspace (0x08) |
\b |
Carriage return (0x0D) |
\r |
Horizontal tab (0x09) |
\t |
Newline (0x0A) |
\n |
Control characters not mentioned above are escaped with uXXXX, where XXXX is the hexadecimal codepoint for the Unicode codepoint. Bytes with improper UTF-8 encoding are substituted with the ufffd Unicode replacement character.
Levels of Verbosity for Logging Queries in MongoDB
You may change the logging verbosity level to increase or decrease the number of log messages produced by MongoDB. The verbosity can be modified for all components collectively or identified components separately.
Only log entries in the severity categories Informational and Debug are affected by verbosity. Above these levels, the severity categories are always displayed.
Set verbosity settings to a high value for extensive logging during debugging or development or a low number to limit log writes on a validated production deployment.
Examine the Current Log Verbosity Level in MongoDB
Use the db.getLogComponents() function to see the current verbosity levels:
db.getLogComponents()
Your output might resemble the following:
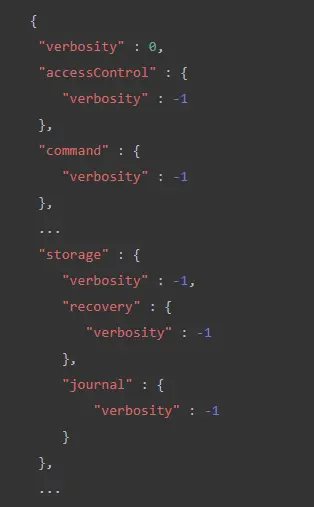
The first entry, verbosity, is the global verbosity level for all components. The subsequently named components, such as accessControl, indicate the specific verbosity level for that component, overriding the global verbosity level if set.
A value of -1 shows that the component will inherit the parent’s verbosity level if it has one of the global verbosity levels if it doesn’t (as with command).
Configure the Log Verbosity Levels in MongoDB
systemLog.verbosity and systemLog.component.name>.verbosity sets the logComponentVerbosity argument, and the db.setLogLevel() function may all be used to change the amount of verbosity.
Use systemLog Verbosity Settings to Control the Level
Use the systemLog.verbosity parameter to specify the default log level for all components. Use the systemLog.component.name>.verbosity settings to control the level of certain components.
The following configuration, for example, sets systemLog.verbosity to 1, systemLog.component.query.verbosity to 2, systemLog.component.storage.verbosity to 2, and systemLog.component.storage.journal.verbosity to 1:
systemLog:
   verbosity: 1
   component:
      query:
         verbosity: 2
      storage:
         verbosity: 2
         journal:
            verbosity: 1
For your mongod or mongos instance, specify these settings in the configuration file or on the command line.
The verbosity level of all components not explicitly given in the configuration is -1. It indicates that they take the verbosity level of their parent if they have one of the global verbosity levels.
Alter the logComponentVerbosity Parameter
Pass a document containing the verbosity settings to alter the logComponentVerbosity option.
The following command, for example, changes the default verbosity level to 2, the query to 3, the storage to 4, and the storage.journal to 1.
db.adminCommand( {
   setParameter: 1,
   logComponentVerbosity: {
      verbosity: 2,
      query: {
         verbosity: 3
      },
      storage: {
         verbosity: 4,
         journal: {
            verbosity: 1
         }
      }
   }
} )
You can set these values from mongosh.
Use db.setLogLevel() to Change Log Level in MongoDB
To change the log level of a single component, use the db.setLogLevel() function. You can define a verbosity level of 0 to 5 for a component or specify -1 to inherit the parent’s verbosity.
For example, setting systemLog.component.query.verbosity to its parent verbosity (i.e. default verbosity) is as follows:
db.setLogLevel(-1, "query")
You can set this value from mongosh.
Log Slow Operations in MongoDB
Client operations (such as queries) are logged if they take longer than the slow operation threshold or if the log verbosity level is set to 1 or higher.
For reading/writing operations, starting with MongoDB 4.2, the profiler entries and diagnostic log messages (i.e.mongod/mongos log messages) include:
queryHash, a function that may detect sluggish searches with the same query form;planCacheKeygives extra information about the query plan cache for slow queries.
Slow operation log messages now include a remote column that specifies the client IP address as of MongoDB 5.0.
The given example output includes information about a slow aggregation operation:
{"t":{"$date":"2020-05-20T20:10:08.731+00:00"},"s":"I", "c":"COMMAND", "id":51803, "ctx":"conn281","msg":"Slow query","attr":{"type":"command","ns":"stocks.trades","appName":"MongoDB Shell","command":{"aggregate":"trades","pipeline":[{"$project":{"ticker":1.0,"price":2.0,"priceGTE110":{"$gte":["$price",111.0]},"_id":0.0}},{"$sort":{"price":-1.0}}],"allowDiskUse":true,"cursor":{},"lsid":{"id":{"$uuid":"fa658f9e-9cd6-42d4-b1c8-c9160fabf2a2"}},"$clusterTime":{"clusterTime":{"$timestamp":{"t":1590005405,"i":1}},"signature":{"hash":{"$binary":{"base64":"AAAAAAAAAAAAAAAAAAAAAAAAAAA=","subType":"0"}},"keyId":0}},"$db":"test"},"planSummary":"COLLSCAN","cursorid":1912190691485054730,"keysExamined":0,"docsExamined":1000001,"hasSortStage":true,"usedDisk":true,"numYields":1002,"nreturned":101,"reslen":17738,"locks":{"ReplicationStateTransition":{"acquireCount":{"w":1119}},"Global":{"acquireCount":{"r":1119}},"Database":{"acquireCount":{"r":1119}},"Collection":{"acquireCount":{"r":1119}},"Mutex":{"acquireCount":{"r":117}}},"storage":{"data":{"bytesRead":232899899,"timeReadingMicros":186017},"timeWaitingMicros":{"cache":849}},"remote": "192.168.14.15:37666","protocol":"op_msg","durationMillis":22427}}
Get Waiting Time for Shards in the remoteOpWaitMillis Field
You can get the wait time (in milliseconds) for results from shards using the remoteOpWaitMillis log field starting in MongoDB 5.0.
Only the following values are reported for remoteOpWaitMillis:
- If sluggish operations, logging is enabled.
- On the shard, or
mongos,that combines the results
Compare the durationMillis and remoteOpWaitMillis time columns in the log to see if a merging operation or a shard problem is causing the slow query. durationMillis is the entire amount of time it took the query to finish.
Specifically,
- If
durationMillisexceedsremoteOpWaitMillis, most of the time was spent waiting for a shard response. For example,durationMillisof18andremoteOpWaitMillisof15are acceptable values. - If
durationMillisis significantly larger thanremoteOpWaitMillis, most of the time was spent doing the merge. For example,durationMillisof150andremoteOpWaitMillisof15.
Filter Results of the Log Queries Within mongosh
The output of getLog can be filtered to make the results easier to read or match specific criteria.
The following command prints only the log field (which contains an array of all current log events) while removing character escaping from each log message:
db.adminCommand( { getLog:'global'} ).log.forEach(x => {print(x)})
In this operation, the output of getLog is presented in the same format as the MongoDB log file.
CAUTION: getLog only displays the last 1024 logged mongod events and is not intended to replace the MongoDB log file.
Filter Results of the Log Queries Outside mongosh With jq
The third-party jq command-line program is handy when dealing with MongoDB structured logging. It enables quick pretty-printing of log entries and robust key-based matching and filtering.
jq is a free and open-source JSON parser for Linux, Windows, and macOS.
You must use the -eval option to mongosh to utilise jq with the getLog output. The following action employs jq to filter the REPL component so that only log messages related to replication are displayed:
mongosh --quiet --eval "db.adminCommand( { getLog:'global'} ).log.forEach(x => {print(x)})" | jq -c '. | select(.c=="REPL")'
Be careful to give mongosh any connection-specific arguments it requires, such as -host or -port.
mongosh --quiet --eval "db.adminCommand( { getLog:'global'} ).log.forEach(x => {print(x)})" | jq -r ".msg" | sort | uniq -c | sort -rn | head -10
Retrieve Available Log Filters
The following operation, run from mongosh, returns the available log filters for passing to getLog:
db.adminCommand( { getLog: "" } )
The operation returns the following document:
{ "names" : [ "global", "startupWarnings" ], "ok" : 1 }
Retrieve Recent Events From Log
The following command, run from mongosh, gets the mongod's most recent global events:
db.adminCommand( { getLog : "global" } )
The operation produces a document that looks like this: