How to Set Minor Ticks in Matplotlib
- Enabling Minor Ticks
- Customizing Minor Ticks
- Setting Specific Locations for Minor Ticks
- Conclusion
- FAQ

Matplotlib is a powerful Python plotting library that allows you to create visually appealing charts and graphs. One of the often-overlooked features of Matplotlib is the ability to set minor ticks on your plots. Minor ticks can greatly enhance the readability of your visualizations by providing additional reference points on the axes.
In this article, we will explore how to enable and customize minor ticks in Matplotlib. Whether you’re a beginner or an experienced user, this guide will help you make your plots more informative and visually appealing. Let’s dive in!
Minor ticks are the smaller tick marks that appear between the major ticks on an axis. They can help to provide more detailed information without cluttering the plot with too many labels. In Matplotlib, minor ticks are disabled by default, but enabling them is a straightforward process.
Enabling Minor Ticks
To enable minor ticks in Matplotlib, you can use the minorticks_on() method, which is a part of the Axes class. This method activates the minor ticks for the current axes. Below is a simple example demonstrating how to enable minor ticks on both the x-axis and the y-axis.
import matplotlib.pyplot as plt
import numpy as np

x = np.linspace(0, 10, 100)
y = np.sin(x)

plt.plot(x, y)
plt.minorticks_on()
plt.show()
Output:
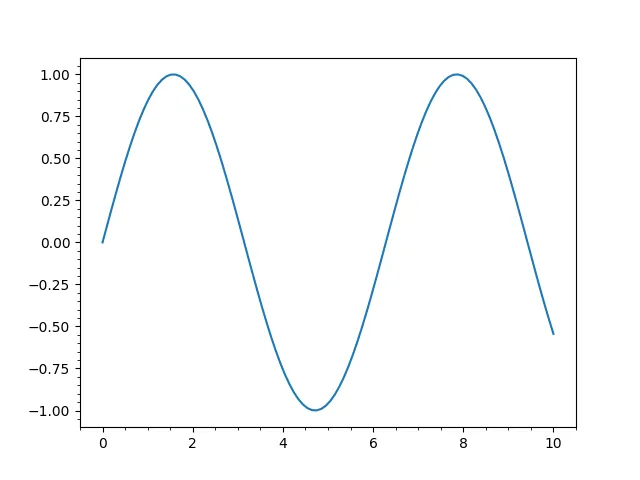
In this code, we first import the necessary libraries and create data for a sine wave. We then plot the data using plt.plot(). The key part of this example is the plt.minorticks_on() line, which activates the minor ticks. After calling this method, you will see additional ticks appear between the major ticks on both axes, enhancing the overall clarity of the plot.
Customizing Minor Ticks
Once you have enabled minor ticks, you may want to customize their appearance to better fit your needs. Matplotlib provides a variety of options for modifying tick properties, such as length, width, and color. You can achieve this by using the tick_params() method. Here’s an example that demonstrates how to customize the minor ticks.
import matplotlib.pyplot as plt
import numpy as np

x = np.linspace(0, 10, 100)
y = np.sin(x)

plt.plot(x, y)
plt.minorticks_on()
plt.tick_params(axis='x', which='minor', length=4, color='red', width=2)
plt.tick_params(axis='y', which='minor', length=4, color='blue', width=2)
plt.show()
Output:
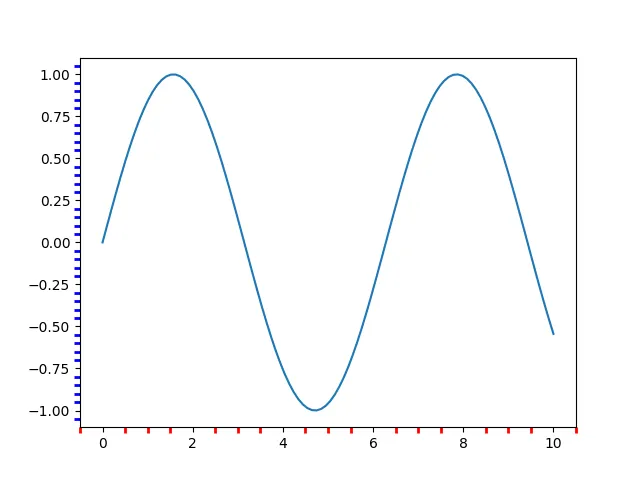
In this example, we use the tick_params() method to customize the minor ticks. The axis parameter specifies which axis to modify (x or y), while the which parameter indicates that we are targeting the minor ticks. You can adjust the length, color, and width of the ticks to make them stand out or blend in with your plot. This level of customization allows you to create visualizations that are not only informative but also aesthetically pleasing.
Setting Specific Locations for Minor Ticks
Sometimes, you may want to have more control over where the minor ticks appear on your axes. Matplotlib allows you to specify custom locations for minor ticks using the set_minor_locator() method along with a locator from the matplotlib.ticker module. Here’s how to do this:
import matplotlib.pyplot as plt
import numpy as np
from matplotlib.ticker import AutoMinorLocator

x = np.linspace(0, 10, 100)
y = np.sin(x)

plt.plot(x, y)
plt.minorticks_on()
plt.gca().xaxis.set_minor_locator(AutoMinorLocator(2))
plt.gca().yaxis.set_minor_locator(AutoMinorLocator(4))
plt.show()
Output:
A sine wave plot with minor ticks set at specified intervals on both axes.
In this code, we import the AutoMinorLocator class from the matplotlib.ticker module. This locator automatically generates minor ticks based on the specified number of intervals. For the x-axis, we set two minor ticks between each major tick, while for the y-axis, we set four minor ticks. This method gives you the flexibility to define how many minor ticks you want and where they should appear, making your plots even more informative.
Conclusion
In summary, enabling and customizing minor ticks in Matplotlib can significantly improve the readability and aesthetics of your plots. By using simple commands like minorticks_on() and tick_params(), you can activate and style minor ticks to fit your visualization needs. Additionally, using locators allows for even greater control over tick placement. With these tools at your disposal, you can create professional-quality plots that effectively convey your data. So go ahead and give your visualizations the clarity they deserve!
FAQ
- How do I enable minor ticks in Matplotlib?
You can enable minor ticks by using theminorticks_on()method on your plot.
-
Can I customize the appearance of minor ticks?
Yes, you can customize minor ticks using thetick_params()method to change their length, color, and width. -
What is the purpose of minor ticks?
Minor ticks provide additional reference points on the axes, enhancing the readability of your plots without cluttering them. -
Can I specify where minor ticks appear?
Yes, you can use theset_minor_locator()method along with locators frommatplotlib.tickerto define the placement of minor ticks. -
Is it necessary to use minor ticks in every plot?
No, minor ticks are optional and should be used based on the complexity of the data and the clarity of the visualization.

Hi, my name is Maxim Maeder, I am a young programming enthusiast looking to have fun coding and teaching you some things about programming.
GitHub