Matplotlib sharex Parameter
This session will discuss the subplot() function and sharing axes. We’ll also explain how to share axes from multiple subplots using the sharex parameter Matplotlib.
the subplot() Function in Matplotlib
The subplot() function represents multiple plots in a single figure where we draw the plots in the same figure. That’s why we can have multiple plots in one figure.
This subplot() function takes these three arguments. The first one represents the row, the second one represents the column, and the third argument represents the index.
Syntax:
subplot(r, c, i)
The r represents the row. The c argument represents a column, and the i argument is the index of the plot. Using these arguments will help you specify a plotting cell, and we can adjust the plotting place in descending order.
Share Axes From Multiple Subplots With sharex Parameter
We’re going to be defining our plots, and it doesn’t matter which one we share the axes with, but it makes sense if we are defining a subplot in "311" order. We have one axis to share the x-axis, so sharex will equal that you could share with a defined subplot.
Changing the axis limits to one axis will be automatically seen in the other, and vice versa. The axes will follow through the toolbar in their shared axes when you navigate through the toolbar.
Now, let’s write the code and see the explanation shortly. Firstly, we need to import the required libraries.
import matplotlib.pyplot as plt
import numpy as np
Create data for x and y values, then we subplot for "311" where "3" is a row and "1" is a column. "1" is an index.
The tick_params() method sets ticks to a given axis. In our case, we just set it for the x-axis.
axis1 = plt.subplot(311)
plt.plot(range_samples, sine)
plt.tick_params("x", labelsize=6)
In this subplot() method we passed axis1 to the sharex parameter. The axis1 is a variable that stores the first subplot, which means we want to share the x-axis of the second subplot with the first subplot.
axis2 = plt.subplot(312, sharex=axis1)
We create a third subplot with shared x and y axes, and this subplot also shares its axis with the first subplot. The xlim() method sets the limitation of the x-axis value, and this is like a range where we can pass it.
axis3 = plt.subplot(313, sharex=axis1, sharex=axis1)
plt.plot(range_samples, sine2)
plt.xlim(0.01, 5.0)
Full Source Code:
import matplotlib.pyplot as plt
import numpy as np

range_samples = np.arange(0.01, 5.0, 0.01)
sine = np.sin(2 * np.pi * range_samples)
inverse = np.exp(-range_samples)
sine2 = np.sin(4 * np.pi * range_samples)

axis1 = plt.subplot(311)
plt.plot(range_samples, sine)
plt.tick_params("x", labelsize=6)

# This line only share x
axis2 = plt.subplot(312, sharex=axis1)
plt.plot(range_samples, inverse)
# make these tick labels invisible
plt.tick_params("x", labelbottom=False)

# This lin share x and y axes
axis3 = plt.subplot(313, sharex=axis1, sharey=axis1)
plt.plot(range_samples, sine2)
plt.xlim(0.01, 5.0)
plt.show()
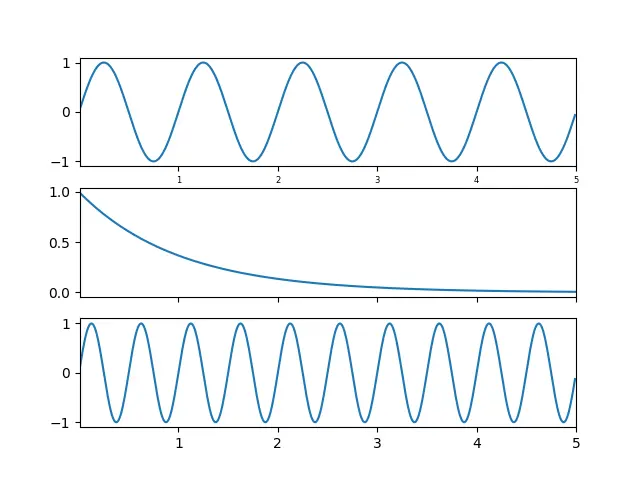
Output:

Hello! I am Salman Bin Mehmood(Baum), a software developer and I help organizations, address complex problems. My expertise lies within back-end, data science and machine learning. I am a lifelong learner, currently working on metaverse, and enrolled in a course building an AI application with python. I love solving problems and developing bug-free software for people. I write content related to python and hot Technologies.
LinkedIn