Matplotlib sharex 参数
本次会议将讨论 subplot() 函数和共享轴。我们还将解释如何使用 sharex 参数 Matplotlib 从多个子图中共享轴。
Matplotlib 中的 subplot() 函数
subplot() 函数表示单个图中的多个图,我们在同一图中绘制图。这就是为什么我们可以在一个图中有多个图。
这个 subplot() 函数采用这三个参数。第一个代表行,第二个代表列,第三个参数代表索引。
语法:
subplot(r, c, i)
r 表示行。c 参数表示一列,i 参数是绘图的索引。使用这些参数将帮助你指定绘图单元,我们可以按降序调整绘图位置。
使用 sharex 参数从多个子图中共享轴
我们将定义我们的绘图,与哪个轴共享轴无关紧要,但如果我们以"311" 顺序定义 subplot 是有意义的。我们有一个轴来共享 x 轴,因此 sharex 将等于你可以与定义的子图共享。
将轴限制更改为一个轴将自动显示在另一个轴上,反之亦然。当你浏览工具栏时,这些轴将在其共享轴中通过工具栏。
现在,让我们编写代码并快速查看解释。首先,我们需要导入所需的库。
import matplotlib.pyplot as plt
import numpy as np
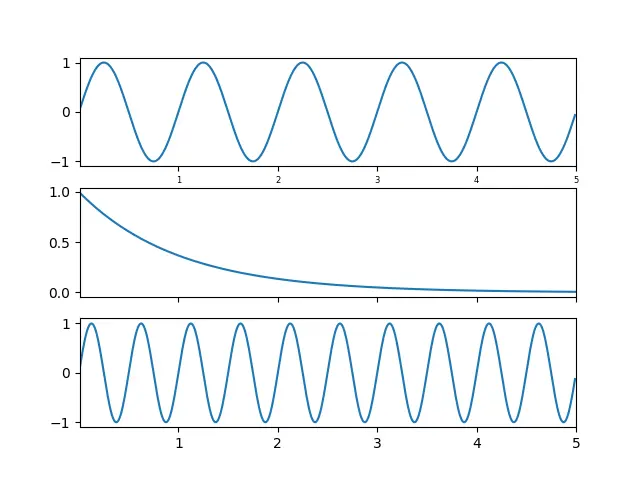
为 x 和 y 值创建数据,然后我们为 "311" 绘制子图,其中 "3" 是一行,"1" 是一列。 "1" 是一个索引。
tick_params() 方法将刻度设置到给定的轴。在我们的例子中,我们只是为 x 轴设置它。
axis1 = plt.subplot(311)
plt.plot(range_samples, sine)
plt.tick_params("x", labelsize=6)
在这个 subplot() 方法中,我们将 axis1 传递给 sharex 参数。axis1 是存储第一个子图的变量,这意味着我们希望与第一个子图共享第二个子图的 x 轴。
axis2 = plt.subplot(312, sharex=axis1)
我们创建了第三个带有共享 x 和 y 轴的子图,并且该子图还与第一个子图共享其轴。xlim() 方法设置 x 轴值的限制,这就像我们可以传递它的范围。
axis3 = plt.subplot(313, sharex=axis1, sharex=axis1)
plt.plot(range_samples, sine2)
plt.xlim(0.01, 5.0)
完整源代码:
import matplotlib.pyplot as plt
import numpy as np

range_samples = np.arange(0.01, 5.0, 0.01)
sine = np.sin(2 * np.pi * range_samples)
inverse = np.exp(-range_samples)
sine2 = np.sin(4 * np.pi * range_samples)

axis1 = plt.subplot(311)
plt.plot(range_samples, sine)
plt.tick_params("x", labelsize=6)

# This line only share x
axis2 = plt.subplot(312, sharex=axis1)
plt.plot(range_samples, inverse)
# make these tick labels invisible
plt.tick_params("x", labelbottom=False)

# This lin share x and y axes
axis3 = plt.subplot(313, sharex=axis1, sharey=axis1)
plt.plot(range_samples, sine2)
plt.xlim(0.01, 5.0)
plt.show()
输出:

Hello! I am Salman Bin Mehmood(Baum), a software developer and I help organizations, address complex problems. My expertise lies within back-end, data science and machine learning. I am a lifelong learner, currently working on metaverse, and enrolled in a course building an AI application with python. I love solving problems and developing bug-free software for people. I write content related to python and hot Technologies.
LinkedIn