How to Create and Change Title Position in Matplotlib
We’ll explain in this article the title() method that allows us to set a name to the plot as a label, and we will see how to change the title position in Matplotlib.
Use the title() Method to Create and Change Title Position in Matplotlib
This function belongs to pyplot module so we need to call matplotlib.pyplot.title().
Syntax:
matplotlib.pyplot.title(label, fontdict=None, loc="center", pad=None, **kwargs)
Here is the definition of the title parameters.
label
The first argument is label, a string value whatever the name you want to give to the plot, so you must pass the label value as a first argument. If we do not mention the label, it will raise an error (required).
fontdict
The second argument is that it is a dictionary that will control the appearance of the title text to change the size of the text, or we can change the color of the text using this parameter. The default value is Null.
loc
This is the third argument, loc, the default value is Null. A string value of this argument will specify where to place the title, whether you want to place it at the center on the left or right side.
pad
The pad argument is a float value that allows us to change the distance of the title from the top of the access. It will take the default value of 6.0 if there’s no value initialize.
kwargs
This is the keyword argument that allows us to change the text properties of the title text. We can change the text’s size, color, or font style to change the text appearance using either the fontdict argument or keyword argument, and we can do the changes using both arguments.
Let’s write some examples to get a better understanding.
Example:
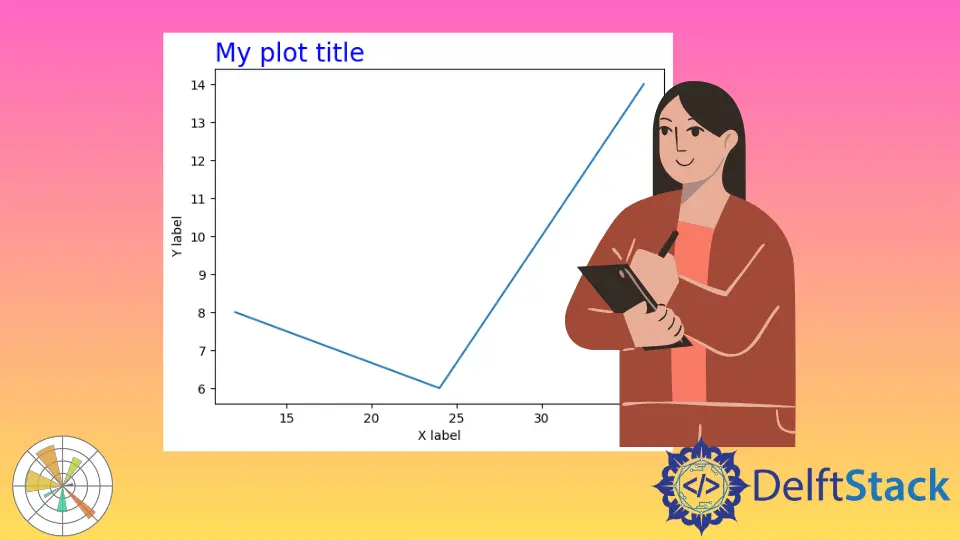
import matplotlib.pyplot as plot

# The x and y values (dependant an independent value)
plot.plot([12, 24, 36], [8, 6, 14])
plot.xlabel("X label")
plot.ylabel("Y label")
plot.title("First Example", {"size": 20, "color": "blue"})
plot.show()
In this example, we’ll look at the text location is centered in default.
Output:
%60-Method-to-Create-and-Change-Title-Position-in-Matplotlib-1.webp)
The loc argument is a location of a title to pass the three values that are left, center, and right.
Example:
import matplotlib.pyplot as plot

# The x and y values (dependant an independent value)
plot.plot([12, 24, 36], [8, 6, 14])
plot.xlabel("X label")
plot.ylabel("Y label")

# Create a title on left upper corner
plot.title("Second Example", {"size": 20, "color": "blue"}, loc="left")
plot.show()
Output:
%60-Method-to-Create-and-Change-Title-Position-in-Matplotlib-2.webp)
We see in the output above that the title position has changed. Another example is with some padding using the pad argument and some rotation using the rotation argument.
Example:
import matplotlib.pyplot as plot

# The x and y values (dependant an independent value)
plot.plot([12, 24, 36], [8, 6, 14])
plot.xlabel("X label")
plot.ylabel("Y label")
# Create a title on top left corner with 22 percent rotation
plot.title(
    "Third Example", {"size": 10, "color": "blue"}, loc="left", pad=10, rotation=22
)
plot.show()
Output:
%60-Method-to-Create-and-Change-Title-Position-in-Matplotlib-3.webp)
The keyword argument works the same as the fontdict argument, but the keyword argument has high priority than the fontdict argument so let’s see an example.
Example:
import matplotlib.pyplot as plot

# The x and y values (dependant an independent value)
plot.plot([12, 24, 36], [8, 6, 14])
plot.xlabel("X label")
plot.ylabel("Y label")
# Create a title on left upper corner with rotion of 22 % angle
plot.title(
    "Fourth Example",
    {"size": 10, "color": "blue"},
    loc="left",
    pad=10,
    rotation=22,
    size=10,
    color="red",
)
plot.show()
Output:
%60-Method-to-Create-and-Change-Title-Position-in-Matplotlib-4.webp)
Now we can see the keyword color argument will be taken. Click here to read more about the Matplotlib title position.

Hello! I am Salman Bin Mehmood(Baum), a software developer and I help organizations, address complex problems. My expertise lies within back-end, data science and machine learning. I am a lifelong learner, currently working on metaverse, and enrolled in a course building an AI application with python. I love solving problems and developing bug-free software for people. I write content related to python and hot Technologies.
LinkedIn