在 Matplotlib 中建立和更改標題位置
我們將在本文中解釋 title() 方法,該方法允許我們為繪圖設定名稱作為標籤,我們將看到如何在 Matplotlib 中更改標題位置。
在 Matplotlib 中使用 title() 方法建立和更改標題位置
這個函式屬於 pyplot 模組,所以我們需要呼叫 matplotlib.pyplot.title()。
語法:
matplotlib.pyplot.title(label, fontdict=None, loc="center", pad=None, **kwargs)
這裡是 title 引數的定義。
label
第一個引數是 label,一個字串值,無論你想為繪圖指定什麼名稱,因此你必須將標籤值作為第一個引數傳遞。如果我們不提及標籤,它將引發錯誤(必需)。
fontdict
第二個引數是一個字典,它將控制標題文字的外觀來改變文字的大小,或者我們可以使用這個引數來改變文字的顏色。預設值為 Null。
loc
這是第三個引數 loc,預設值為 Null。此引數的字串值將指定放置標題的位置,無論你是將其放置在左側還是右側的中心。
pad
pad 引數是一個浮點值,允許我們更改標題與訪問頂部的距離。如果沒有值初始化,它將採用預設值 6.0。
kwargs
這是允許我們更改標題文字的文字屬性的關鍵字引數。我們可以使用 fontdict 引數或關鍵字引數更改文字的大小、顏色或字型樣式以更改文字外觀,並且我們可以使用這兩個引數進行更改。
讓我們寫一些例子來更好地理解。
例子:
import matplotlib.pyplot as plot
# The x and y values (dependant an independent value)
plot.plot([12, 24, 36], [8, 6, 14])
plot.xlabel("X label")
plot.ylabel("Y label")
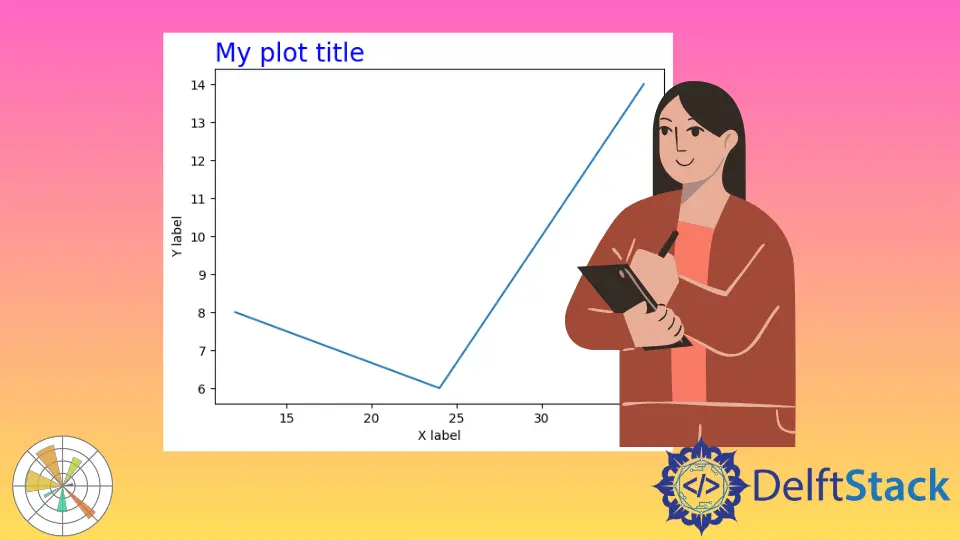
plot.title("First Example", {"size": 20, "color": "blue"})
plot.show()
在此示例中,我們將檢視預設居中的文字位置。
輸出:
%60-Method-to-Create-and-Change-Title-Position-in-Matplotlib-1.webp)
loc 引數是標題的位置,用於傳遞左、中和右三個值。
例子:
import matplotlib.pyplot as plot

# The x and y values (dependant an independent value)
plot.plot([12, 24, 36], [8, 6, 14])
plot.xlabel("X label")
plot.ylabel("Y label")

# Create a title on left upper corner
plot.title("Second Example", {"size": 20, "color": "blue"}, loc="left")
plot.show()
輸出:
%60-Method-to-Create-and-Change-Title-Position-in-Matplotlib-2.webp)
我們在上面的輸出中看到標題位置發生了變化。另一個例子是使用 pad 引數進行一些填充和使用 rotation 引數進行一些旋轉。
例子:
import matplotlib.pyplot as plot

# The x and y values (dependant an independent value)
plot.plot([12, 24, 36], [8, 6, 14])
plot.xlabel("X label")
plot.ylabel("Y label")
# Create a title on top left corner with 22 percent rotation
plot.title(
    "Third Example", {"size": 10, "color": "blue"}, loc="left", pad=10, rotation=22
)
plot.show()
輸出:
%60-Method-to-Create-and-Change-Title-Position-in-Matplotlib-3.webp)
keyword 引數與 fontdict 引數的工作方式相同,但 keyword 引數比 fontdict 引數具有更高的優先順序,所以讓我們看一個示例。
例子:
import matplotlib.pyplot as plot

# The x and y values (dependant an independent value)
plot.plot([12, 24, 36], [8, 6, 14])
plot.xlabel("X label")
plot.ylabel("Y label")
# Create a title on left upper corner with rotion of 22 % angle
plot.title(
    "Fourth Example",
    {"size": 10, "color": "blue"},
    loc="left",
    pad=10,
    rotation=22,
    size=10,
    color="red",
)
plot.show()
輸出:
%60-Method-to-Create-and-Change-Title-Position-in-Matplotlib-4.webp)
現在我們可以看到關鍵字 color 引數將被採用。點選這裡閱讀更多關於 Matplotlib 標題位置的資訊。

Hello! I am Salman Bin Mehmood(Baum), a software developer and I help organizations, address complex problems. My expertise lies within back-end, data science and machine learning. I am a lifelong learner, currently working on metaverse, and enrolled in a course building an AI application with python. I love solving problems and developing bug-free software for people. I write content related to python and hot Technologies.
LinkedIn