How to Show Pyplot Grid in Matplotlib
- Draw a Normal Plot in Matplotlib
-
Use
grid()on a Plot in Matplotlib - Change the Grid Attributes in Matplotlib
- Draw Either Vertical or Horizontal Lines

This tutorial explains how to draw a grid on top of a plot in Python Matplotlib. We will use the grid() function to achieve this. It also demonstrates how to use the grid() function arguments to customize the grid color and shape and even draw either the vertical or horizontal lines only.
Draw a Normal Plot in Matplotlib
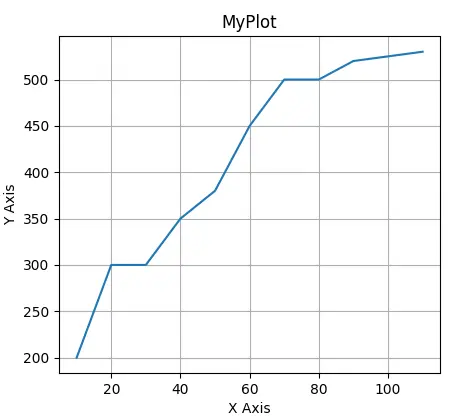
Let’s start by creating two lists to represent x and y values and use them to draw a plot. Call the plot() function and pass x and y lists as arguments, then call the show() function.
Use title(), xlabel and ylabel() functions to add title and labels to your plot to make it understandable.
from matplotlib import pyplot as plt

x = [10, 20, 30, 40, 50, 60, 70, 80, 90, 100, 110]
y = [200, 300, 300, 350, 380, 450, 500, 500, 520, 525, 530]

plt.title("MyPlot")
plt.xlabel("X Axis")
plt.ylabel("Y Axis")

plt.plot(x, y)
plt.show()
Output:

But a normal plot seems boring and missing something. Now, we need to add a grid to our plot.
Use grid() on a Plot in Matplotlib
We will use the Matplotlib grid() function to draw a grid on top of the plot.
We need to call the grid() function before show(), and that will draw a grid on the previous plot.
See the code below.
from matplotlib import pyplot as plt

x = [10, 20, 30, 40, 50, 60, 70, 80, 90, 100, 110]
y = [200, 300, 300, 350, 380, 450, 500, 500, 520, 525, 530]

plt.title("MyPlot")
plt.xlabel("X Axis")
plt.ylabel("Y Axis")

plt.plot(x, y)
plt.grid()
plt.show()
Output:
Change the Grid Attributes in Matplotlib
The grid() function accepts arguments to customize the grid color and style. We can call grid() like this grid(color='r', linestyle='dotted', linewidth=1) to get a grid with red, dotted and thin lines.
from matplotlib import pyplot as plt

x = [10, 20, 30, 40, 50, 60, 70, 80, 90, 100, 110]
y = [200, 300, 300, 350, 380, 450, 500, 500, 520, 525, 530]

plt.title("MyPlot")
plt.xlabel("X Axis")
plt.ylabel("Y Axis")

plt.plot(x, y)
plt.grid(color="r", linestyle="dotted", linewidth=1)
plt.show()
Output:

The linewidth is of float data type, and here are all the color codes and line styles available to you.
Valid color codes:
| code | color |
|---|---|
b |
blue |
g |
green |
r |
red |
c |
cyan |
m |
magenta |
y |
yellow |
k |
black |
w |
white |
Valid line styles:
----.:None- ``
soliddasheddashdotdotted
Draw Either Vertical or Horizontal Lines
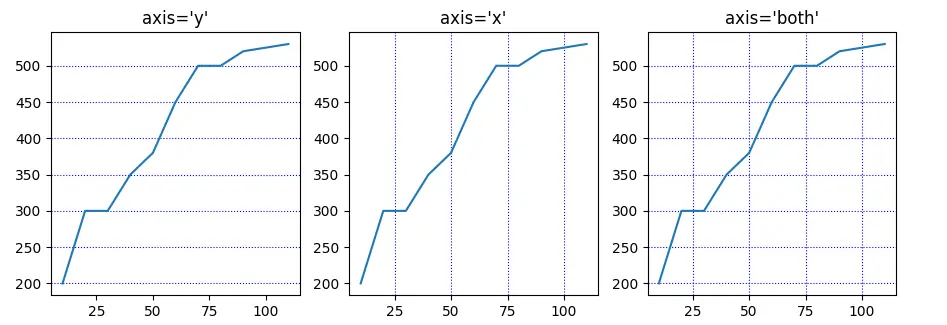
The default of the grid() function is to draw both horizontal and vertical axes, but you may want to customize this as well. You can use the axis argument to do this. Call the grid() with axis='x' to draw just the vertical lines or axis='y' to draw just the horizontal lines or axis='both' to draw them both, which is the default behavior.
See the code below and its output.
from matplotlib import pyplot as plt

x = [10,20,30,40,50,60,70,80,90,100,110]
y = [200,300,300,350,380,450,500,500,520,525,530]

_, (a, b, c) =  plt.subplots(1,3)

a.grid(axis='y',linestyle='dotted', color='b')
a.plot(x, y)
a.set_title("axis='y'")

b.grid(axis='x',linestyle='dotted', color='b')
b.plot(x, y)
b.set_title("axis='x'")

c.grid(axis='both',linestyle='dotted', color='b')
c.plot(x, y)
c.set_title("axis='both'")

plt.show()
Output: