HOWTO · Matplotlib
How to Plot a 2D Heatmap With Matplotlib
We can plot a 2D heatmap using imshow() function,seaborn library and pcolormesh() function.
On this page
To plot a 2D heatmap, we can use any of the following methods:
imshow()function with parametersinterpolation='nearest'andcmap='hot'Seabornlibrarypcolormesh()function
imshow() Function to Plot 2D Heatmap
Syntax for we can use the imshow function:
matplotlib.pyplot.imshow(X,
                         cmap=None,
                         norm=None,
                         aspect=None,
                         interpolation=None,
                         alpha=None,
                         vmin=None,
                         vmax=None,
                         origin=None,
                         extent=None,
                         shape= < deprecated parameter > ,
                         filternorm=1,
                         filterrad=4.0,
                         imlim= < deprecated parameter > ,
                         resample=None,
                         url=None,
                         *,
                         data=None,
                         **kwargs)
Example Codes:
import numpy as np
import matplotlib.pyplot as plt

data = np.random.random((8, 8))
plt.imshow(data, cmap="cool", interpolation="nearest")
plt.show()
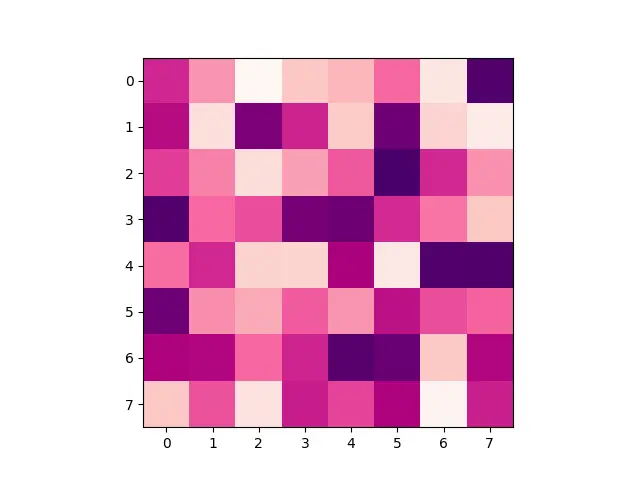
cmap is color map and we can choose another built-in colormaps too from here.
interpolation is the interpolation method that could be nearest, bilinear, hamming, etc.
2D Heatmap With Seaborn Library
The Seaborn library is built on top of Matplotlib. We could use seaborn.heatmap() function to create 2D heatmap.
import numpy as np
import seaborn as sns
import matplotlib.pylab as plt

data = np.random.rand(8, 8)
ax = sns.heatmap(data, linewidth=0.3)
plt.show()
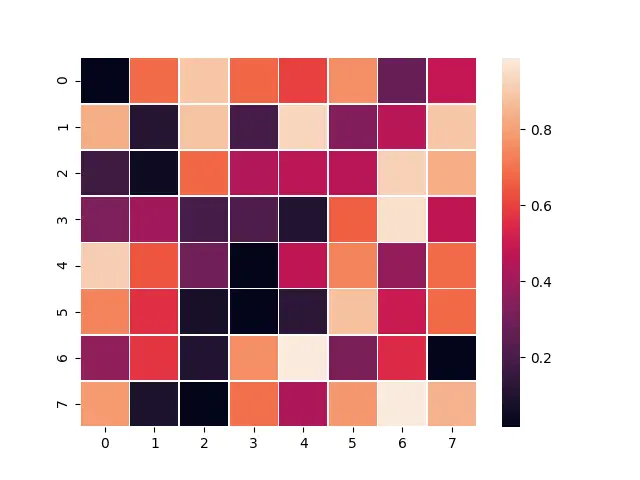
Seaborn also plots a gradient at the side of the heatmap.
pcolormesh() Function
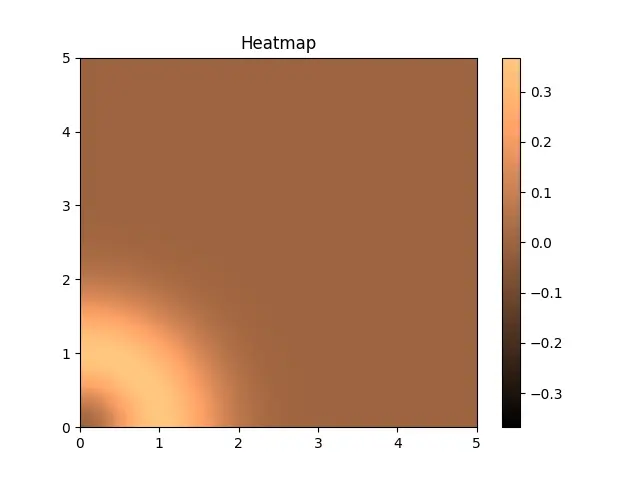
Another way to plot 2D heatmap is using pcolormesh() function ,which creates a pseudo-color plot with a non-regular rectangular grid. It is a faster alternative to pcolor() function.
import numpy as np
import matplotlib.pyplot as plt

b, a = np.meshgrid(np.linspace(0, 5, 130), np.linspace(0, 5, 130))

c = (a ** 2 + b ** 2) * np.exp(-(a ** 2) - b ** 2)
c = c[:-1, :-1]
l_a = a.min()
r_a = a.max()
l_b = b.min()
r_b = b.max()
l_c, r_c = -np.abs(c).max(), np.abs(c).max()

figure, axes = plt.subplots()

c = axes.pcolormesh(a, b, c, cmap="copper", vmin=l_c, vmax=r_c)
axes.set_title("Heatmap")
axes.axis([l_a, r_a, l_b, r_b])
figure.colorbar(c)

plt.show()
Output: