Comment tracer une carte thermique 2D avec Matplotlib
-
Fonction
imshow()pour tracer une carte thermique 2D -
Carte thermique 2D avec bibliothèque
Seaborn -
Fonction
pcolormesh()

Pour tracer une carte thermique 2D, nous pouvons utiliser l’une des méthodes suivantes:
imshow()function with parametersinterpolation='nearest'andcmap='hot'- Bibliothèque
Seaborn - fonction
pcolormesh()
Fonction imshow() pour tracer une carte thermique 2D
Syntaxe car nous pouvons utiliser la fonction imshow:
matplotlib.pyplot.imshow(X,
                         cmap=None,
                         norm=None,
                         aspect=None,
                         interpolation=None,
                         alpha=None,
                         vmin=None,
                         vmax=None,
                         origin=None,
                         extent=None,
                         shape= < deprecated parameter > ,
                         filternorm=1,
                         filterrad=4.0,
                         imlim= < deprecated parameter > ,
                         resample=None,
                         url=None,
                         *,
                         data=None,
                         **kwargs)
Exemples de codes:
import numpy as np
import matplotlib.pyplot as plt

data = np.random.random((8, 8))
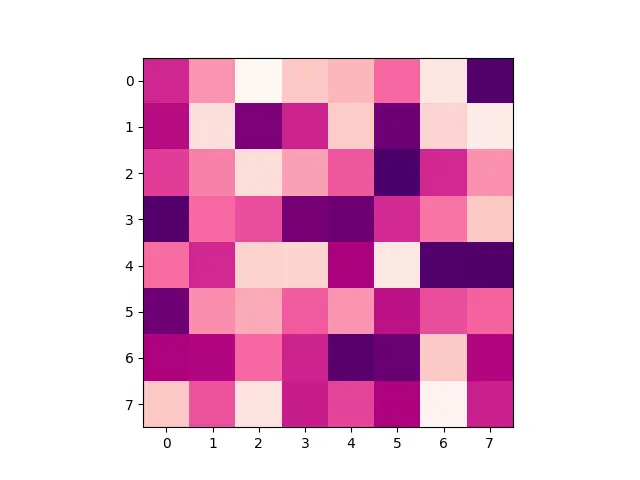
plt.imshow(data, cmap="cool", interpolation="nearest")
plt.show()

cmap est une carte de couleur et nous pouvons également choisir un autre colormaps intégré à partir de ici.
interpolation est la méthode d’interpolation qui pourrait être la plus proche, bilinéaire, hamming, etc.
Carte thermique 2D avec bibliothèque Seaborn
La bibliothèque Seaborn est construite au-dessus de Matplotlib. Nous pourrions utiliser la fonction seaborn.heatmap() pour créer une carte thermique 2D.
import numpy as np
import seaborn as sns
import matplotlib.pylab as plt

data = np.random.rand(8, 8)
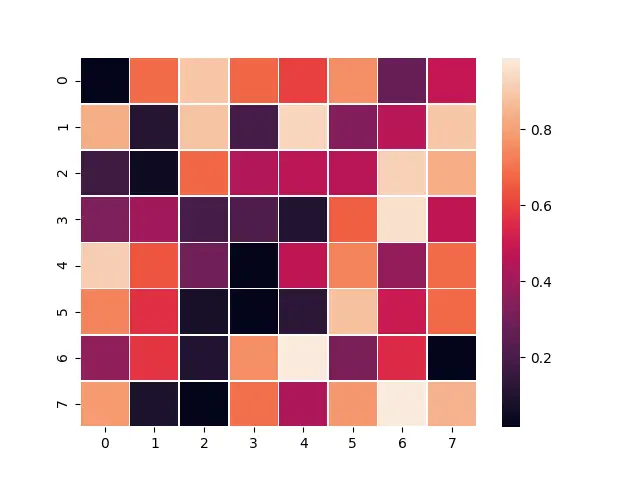
ax = sns.heatmap(data, linewidth=0.3)
plt.show()

Seaborn trace également un dégradé sur le côté de la carte thermique.
Fonction pcolormesh()
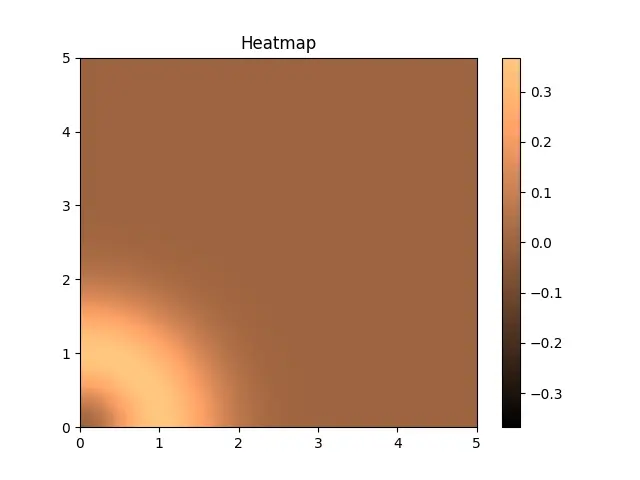
Une autre façon de tracer une carte thermique 2D est d’utiliser la fonction pcolormesh(), qui crée un tracé pseudo-couleur avec une grille rectangulaire non régulière. Il s’agit d’une alternative plus rapide à la fonction pcolor().
import numpy as np
import matplotlib.pyplot as plt

b, a = np.meshgrid(np.linspace(0, 5, 130), np.linspace(0, 5, 130))

c = (a ** 2 + b ** 2) * np.exp(-(a ** 2) - b ** 2)
c = c[:-1, :-1]
l_a = a.min()
r_a = a.max()
l_b = b.min()
r_b = b.max()
l_c, r_c = -np.abs(c).max(), np.abs(c).max()

figure, axes = plt.subplots()

c = axes.pcolormesh(a, b, c, cmap="copper", vmin=l_c, vmax=r_c)
axes.set_title("Heatmap")
axes.axis([l_a, r_a, l_b, r_b])
figure.colorbar(c)

plt.show()
Production:

Suraj Joshi is a backend software engineer at Matrice.ai.
LinkedIn