How to Draw Rectangle on Image in Matplotlib
When we need to draw a rectangle on an image or plain figure in Matplotlib, the rectangle patch from matplotlib.patches should be added to the axes by add_patch method.
A Matpotlib patch is a 2-D artist that has a face and edge color. Matplotlib has patches like,
ArcArrowArrowStyleBoxStyleCircleCirclePolygonConnectionPatchConnectionStyleEllipseFancyArrowFancyArrowPatchFancyBboxPatchPatchPathPathPatchPolygonRectangleRegularPolygonShadowWedge
Rectangle patch draws a rectangle with a specified coordinate of lower left corner and specified width and height.
Rectangle(xy, width, height, angle=0.0, fill=True, **kwargs)
xy is a length-2 tuple to specify the coordinates of lower left corner of the rectangle to be drawn,
width is the rectangle’s width,
height is the rectangle’s height,
angle is the anti-clockwise angle in degrees.
fill specifies whether the rectangle is filled with the facecolor.
Some valid kwargs are,
edgecolor: the color of edges of the rectanglefacecolor: the filled color of the rectangle
Draw Rectangle in Matplotlib
import matplotlib.pyplot as plt
import matplotlib.patches as patches

fig, ax = plt.subplots()

ax.plot([1, 4], [1, 4])

ax.add_patch(
    patches.Rectangle((1, 1), 0.5, 0.5, edgecolor="blue", facecolor="red", fill=True)
)

plt.show()
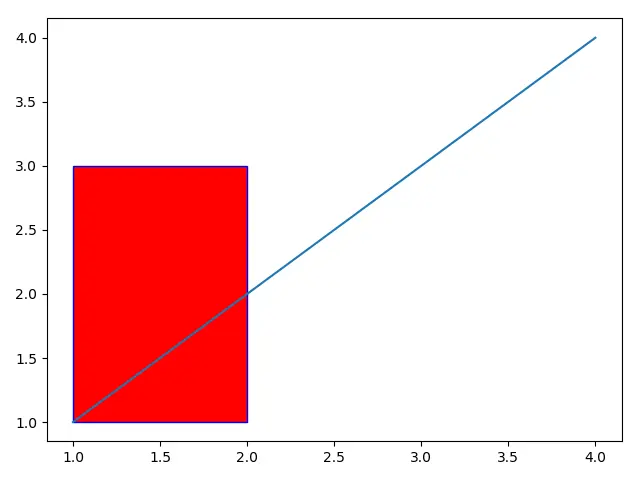
The rectangle patch is created by the constructor,
patches.Rectangle((1, 1), 1, 2, edgecolor="blue", facecolor="red", fill=True)
Its left bottom corner’s coordinate is (1, 1), its width is 1 and height is 2.
The edge color is specified as blue, meanwhile, the filled color is red.
add_patch(P) method of Axes object adds a Patch - p to the axis.
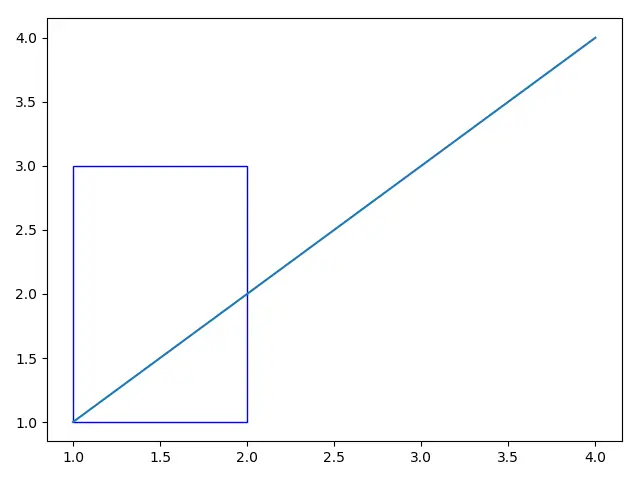
If fill is set to be False, the rectangle will not be filled even facecolor is specified with some color.
import matplotlib.pyplot as plt
import matplotlib.patches as patches

fig, ax = plt.subplots()

ax.plot([1, 4], [1, 4])

ax.add_patch(
    patches.Rectangle((1, 1), 1, 2, edgecolor="blue", facecolor="red", fill=False)
)

plt.show()
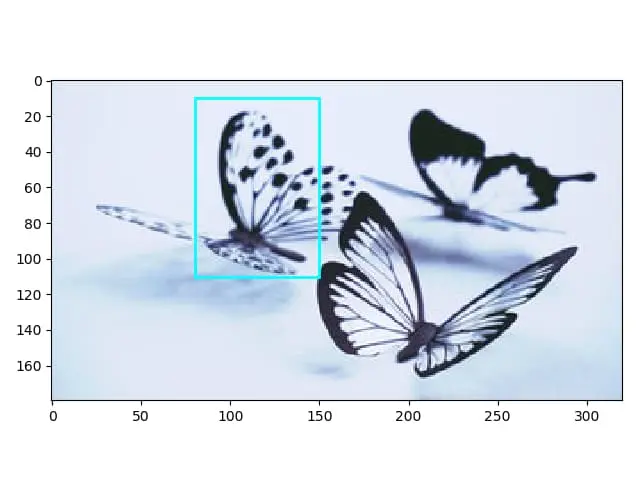
Draw Rectangle on Image in Matplotlib
If we need to draw a rectangle on an image in Matplotlib, it is similar to the above approach but with the extra step to get the Axes handle.
import matplotlib.pyplot as plt
import matplotlib.patches as patches
from PIL import Image

im = Image.open("butterfly.jpg")

plt.imshow(im)

ax = plt.gca()

rect = patches.Rectangle((80, 10), 70, 100, linewidth=2, edgecolor="cyan", fill=False)

ax.add_patch(rect)

plt.show()
plt.imshow(im) displays the image butterfly.jpg and the handle of Axes could be got by the function plt.gca() whose gca means get current axes.

Founder of DelftStack.com. Jinku has worked in the robotics and automotive industries for over 8 years. He sharpened his coding skills when he needed to do the automatic testing, data collection from remote servers and report creation from the endurance test. He is from an electrical/electronics engineering background but has expanded his interest to embedded electronics, embedded programming and front-/back-end programming.
LinkedIn Facebook