Cómo dibujar un rectángulo en una imagen en Matplotlib

Cuando necesitemos dibujar un rectángulo en una imagen o figura plana en Matplotlib, el parche de rectangle de matplotlib.patches debe ser añadido a los ejes por el método add_patch.
Un Matpotlib patch es un artista en 2-D que tiene un color de cara y borde. Matplotlib tiene parches como,
ArcArrowArrowStyleBoxStyleCircleCirclePolygonConnectionPatchConnectionStyleEllipseFancyArrowFancyArrowPatchFancyBboxPatchPatchPathPathPatchPolygonRectangleRegularPolygonShadowWedge
El parche Rectangle dibuja un rectángulo con una coordenada especificada de la esquina inferior izquierda y una anchura y altura especificadas.
Rectangle(xy, width, height, angle=0.0, fill=True, **kwargs)
xy es una tupla de longitud 2 para especificar las coordenadas de la esquina inferior izquierda del rectángulo a dibujar,
width es el ancho del rectángulo,
La height es la altura del rectángulo,
El angle es el ángulo en sentido contrario a las agujas del reloj en grados.
fill especifica si el rectángulo se rellena con el facecolor.
Algunos kwargs válidos lo están,
edgecolor: el color de los bordes del rectángulofacecolor: el color de relleno del rectángulo.
Dibujar el rectángulo en Matplotlib
import matplotlib.pyplot as plt
import matplotlib.patches as patches

fig, ax = plt.subplots()

ax.plot([1, 4], [1, 4])

ax.add_patch(
    patches.Rectangle((1, 1), 0.5, 0.5, edgecolor="blue", facecolor="red", fill=True)
)

plt.show()
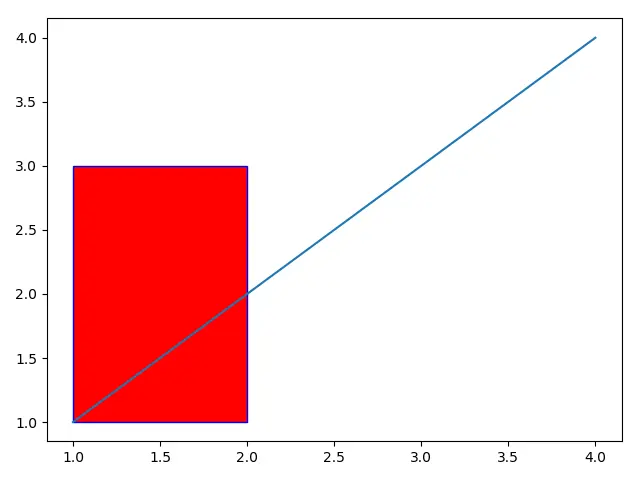
El parche del rectángulo es creado por el constructor,
patches.Rectangle((1, 1), 1, 2, edgecolor="blue", facecolor="red", fill=True)
La coordenada de su esquina inferior izquierda es (1, 1), su ancho es 1 y su altura es 2.
El color del borde se especifica como blue, mientras que el color de relleno es red.
El método add_patch(P) del objeto Axes añade un Patch - p al axis.
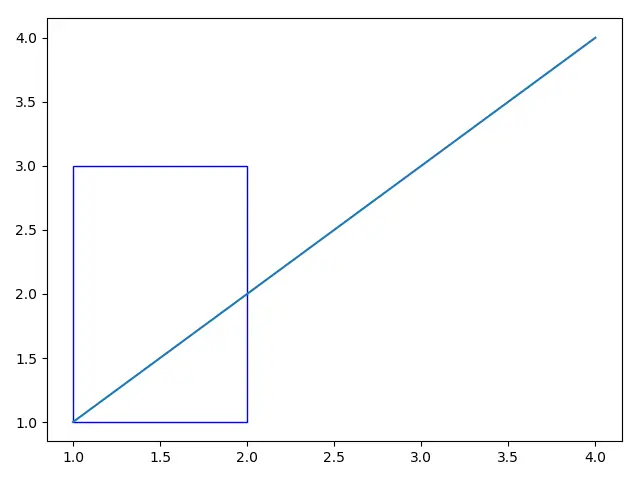
Si fill se establece como False, el rectángulo no se rellenará incluso si se especifica facecolor con algún color.
import matplotlib.pyplot as plt
import matplotlib.patches as patches

fig, ax = plt.subplots()

ax.plot([1, 4], [1, 4])

ax.add_patch(
    patches.Rectangle((1, 1), 1, 2, edgecolor="blue", facecolor="red", fill=False)
)

plt.show()
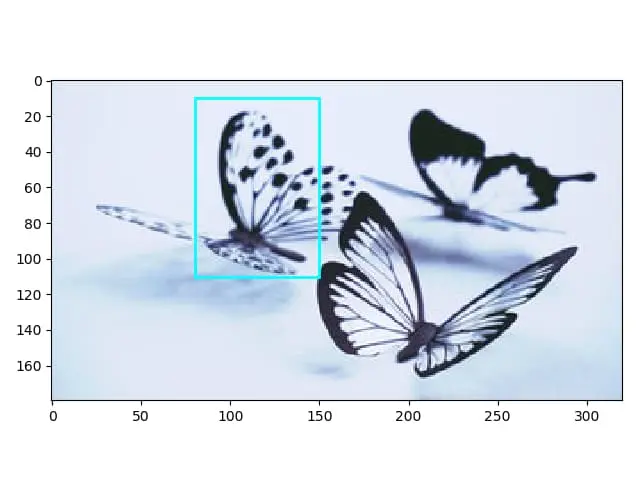
Dibujar el rectángulo en la imagen en Matplotlib
Si necesitamos dibujar un rectángulo en una imagen en Matplotlib, es similar al enfoque anterior pero con el paso extra para obtener el mango de Axes.
import matplotlib.pyplot as plt
import matplotlib.patches as patches
from PIL import Image

im = Image.open("butterfly.jpg")

plt.imshow(im)

ax = plt.gca()

rect = patches.Rectangle((80, 10), 70, 100, linewidth=2, edgecolor="cyan", fill=False)

ax.add_patch(rect)

plt.show()
plt.imshow(im) muestra la imagen butterfly.jpg y el handle de Axes podría obtenerse con la función plt.gca() cuyo gca significa get current axes.

Founder of DelftStack.com. Jinku has worked in the robotics and automotive industries for over 8 years. He sharpened his coding skills when he needed to do the automatic testing, data collection from remote servers and report creation from the endurance test. He is from an electrical/electronics engineering background but has expanded his interest to embedded electronics, embedded programming and front-/back-end programming.
LinkedIn Facebook