How to Fill Between Multiple Lines in Matplotlib
- Understanding the Basics of fill_between()
- Filling Between Two Lines
- Filling Between Multiple Lines
- Customizing the Fill Colors and Styles
- Conclusion
- FAQ

Creating visually appealing plots is essential in data visualization, and Matplotlib is one of the most popular libraries for this purpose in Python. One common task is to fill the area between multiple lines on a graph, which can help emphasize the differences or relationships between datasets. While the fill_between() function in Matplotlib is designed to fill the area between two lines, it can be a bit tricky when you want to fill the area between multiple lines.
In this article, we will explore how to effectively fill between multiple lines using Matplotlib. We will walk through various methods and provide clear code examples to illustrate each approach. By the end of this guide, you will have a solid understanding of how to enhance your plots by filling areas between multiple lines, making your visualizations more informative and engaging.
Understanding the Basics of fill_between()
Before diving into the methods, it’s important to understand the fill_between() function. This function allows you to fill the area between two horizontal curves or lines. The basic syntax looks like this:
plt.fill_between(x, y1, y2, where=(condition), color='color', alpha=opacity)
Here, x is the x-coordinates of the data points, y1 and y2 are the y-coordinates of the lines you want to fill between, and condition specifies where to fill. The color parameter defines the fill color, while alpha controls the transparency.
Now, let’s look at how to apply this function to fill between multiple lines.
Filling Between Two Lines
To start with, let’s fill the area between two lines. This is the most straightforward use of the fill_between() function. Here’s a simple example:
import matplotlib.pyplot as plt
import numpy as np

x = np.linspace(0, 10, 100)
y1 = np.sin(x)
y2 = np.cos(x)

plt.plot(x, y1, label='sin(x)')
plt.plot(x, y2, label='cos(x)')
plt.fill_between(x, y1, y2, color='lightblue', alpha=0.5)
plt.title('Filling Between Two Lines')
plt.legend()
plt.show()
Output:
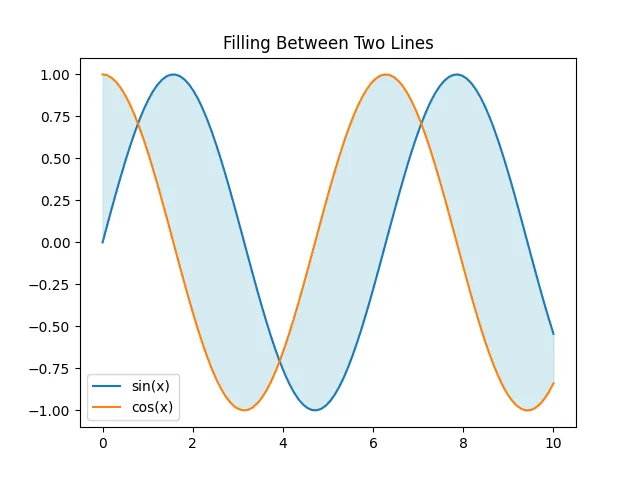
In this code, we first import the necessary libraries and create an array of x-coordinates. We then compute the sine and cosine values for these coordinates. The plt.plot() function is used to draw the two lines, and plt.fill_between() fills the area between them with a light blue color at 50% opacity. This simple example demonstrates the foundational use of fill_between().
Filling Between Multiple Lines
Now, let’s explore how to fill between multiple lines. This involves selecting specific pairs of lines and filling the area between them. For instance, we can fill the area between the sine and cosine curves while also filling the area between the sine curve and a horizontal line at zero. Here’s how to do it:
import matplotlib.pyplot as plt
import numpy as np

x = np.linspace(0, 10, 100)
y1 = np.sin(x)
y2 = np.cos(x)

plt.figure(figsize=(10, 5))
plt.plot(x, y1, label='sin(x)')
plt.plot(x, y2, label='cos(x)')
plt.axhline(0, color='black', lw=0.5)

plt.fill_between(x, y1, y2, where=(y1 > y2), color='lightgreen', alpha=0.5)
plt.fill_between(x, y1, 0, where=(y1 > 0), color='lightcoral', alpha=0.5)
plt.fill_between(x, y2, 0, where=(y2 > 0), color='lightyellow', alpha=0.5)

plt.title('Filling Between Multiple Lines')
plt.legend()
plt.show()
Output:
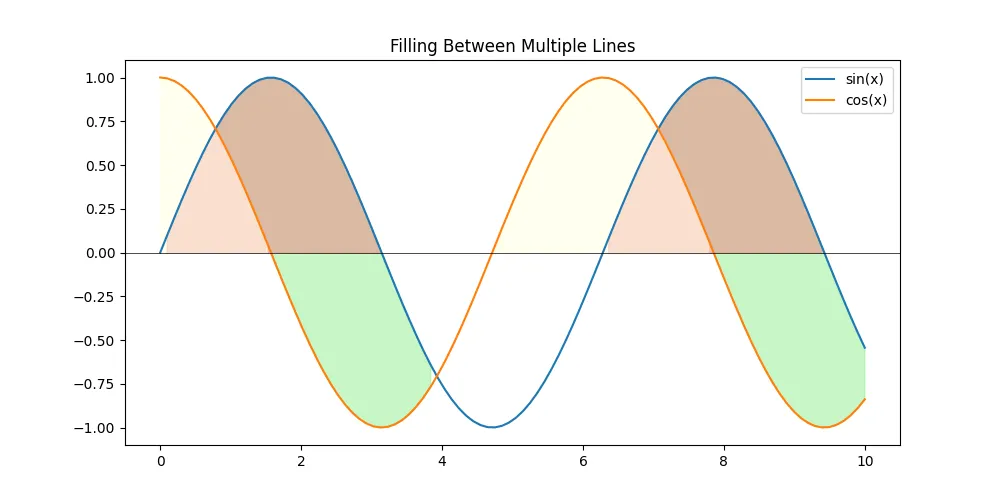
In this example, we first plot the sine and cosine lines, along with a horizontal line at y=0. The fill_between() function is called three times. The first call fills the area where y1 (sin) is greater than y2 (cos) with light green. The second and third calls fill the areas where the sine and cosine curves are above the horizontal line, respectively, using different colors. This approach allows us to create a rich visualization that highlights the relationships between the lines.
Customizing the Fill Colors and Styles
Customizing the fill colors and styles can greatly enhance the visual appeal of your plots. You can experiment with different colors, opacities, and even patterns to convey your message more effectively. Let’s look at an example where we customize the fills further:
plt.figure(figsize=(10, 5))
plt.plot(x, y1, label='sin(x)', color='blue')
plt.plot(x, y2, label='cos(x)', color='orange')
plt.axhline(0, color='black', lw=0.5)

plt.fill_between(x, y1, y2, where=(y1 > y2), color='lightgreen', alpha=0.6, hatch='//')
plt.fill_between(x, y1, 0, where=(y1 > 0), color='lightcoral', alpha=0.6, hatch='\\')
plt.fill_between(x, y2, 0, where=(y2 > 0), color='lightyellow', alpha=0.6, hatch='x')

plt.title('Customizing Fill Between Multiple Lines')
plt.legend()
plt.show()
Output:
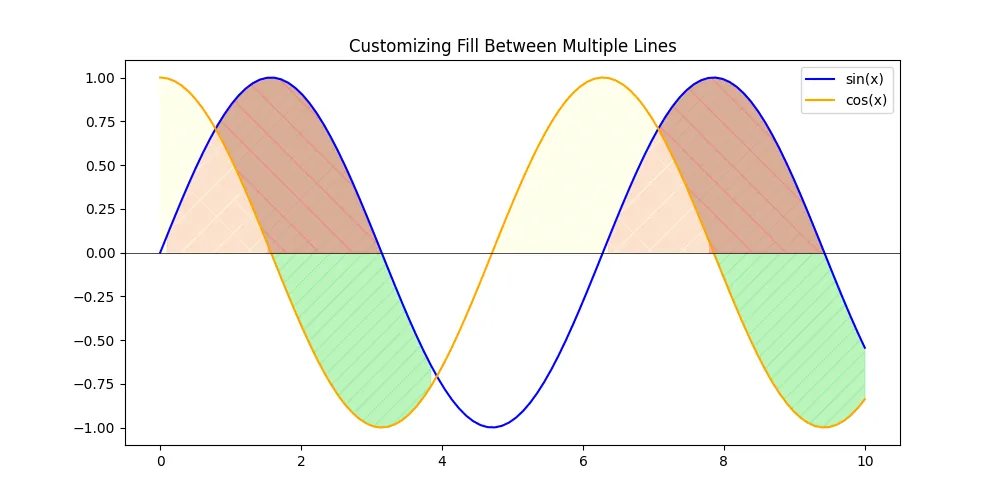
In this code, we add hatching patterns to the filled areas by using the hatch parameter. Each fill has a different pattern, making it easier to distinguish between them. This customization can be particularly useful when printing in black and white or when you want to add an artistic touch to your visualizations.
Conclusion
Filling between multiple lines in Matplotlib can significantly enhance the clarity and aesthetics of your plots. Whether you’re highlighting differences between datasets or simply making your graphs more engaging, the fill_between() function provides a versatile tool for achieving this. By mastering the techniques outlined in this article, you can create dynamic visualizations that effectively communicate your data insights.
Experiment with different styles, colors, and combinations to find what works best for your specific needs. With practice, you’ll be able to create stunning plots that not only look great but also convey your data’s story effectively.
FAQ
-
What is the purpose of the fill_between() function in Matplotlib?
The fill_between() function is used to fill the area between two horizontal curves or lines on a plot, allowing for better visualization of the differences between datasets. -
Can I fill between more than two lines in Matplotlib?
Yes, you can fill between multiple lines by calling the fill_between() function multiple times, specifying different pairs of lines for each call. -
How can I customize the fill colors and patterns in Matplotlib?
You can customize the fill colors and patterns using parameters like color, alpha, and hatch in the fill_between() function. -
Is it possible to fill areas below a line in Matplotlib?
Yes, you can fill areas below a line by using the fill_between() function and setting the second argument to a constant value, such as zero. -
What are some best practices for visualizing data with filled areas?
Use contrasting colors for filled areas, ensure that the fills do not overwhelm the main data lines, and consider using patterns for clarity in black-and-white prints.

Suraj Joshi is a backend software engineer at Matrice.ai.
LinkedIn