How to Plot 3D Line Plot in Matplotlib

This tutorial demonstrates creating a 3D plot in Matplotlib and how to create it with multiple colors in Matplotlib.
Create a 3D Line Plot in Matplotlib
The concept of graphing in three dimensions exists everywhere. The pipes flowing the water, oil, gasoline, or whatever we are piping are three-dimensional with length, width and height.
So we can also create graphs or plots using the mpl_toolkits tool that makes it easier to create 3D plots in Matplotlib.
Let’s get started by importing the following modules.
import numpy as np
import matplotlib.pyplot as plot
from mpl_toolkits import mplot3d
Now we have to specify coordinates, but before we can start plotting in three dimensions, we need to create an axis, and this axis has to have a 3D projection parameter. We have different projections.
We do not have only 3D projections. There is a large list of different projections that we can use, so if we want to create a new axis, we need to call the axes() method.
To create a 3D plot, we can pass a projection parameter and set the value as "3d".
axes = plot.axes(projection="3d")
We create data for three dimensions using the arange() numpy method. The arange() is you choose a starting point, an ending point, and the step size.
We go to do the same thing for the y_data. We are using some math function on the z coordinate to get a better result in our plot.
axes = plot.axes(projection="3d")
x_data = np.arange(0, 50, 0.1)
y_data = np.arange(0, 50, 0.1)
z_data = np.sin(x_data) * np.cos(y_data)
Full Code Example:
import numpy as np
import matplotlib.pyplot as plot
from mpl_toolkits import mplot3d
axes = plot.axes(projection="3d")
x_data = np.arange(0, 50, 0.1)
y_data = np.arange(0, 50, 0.1)
z_data = np.sin(x_data) * np.cos(y_data)
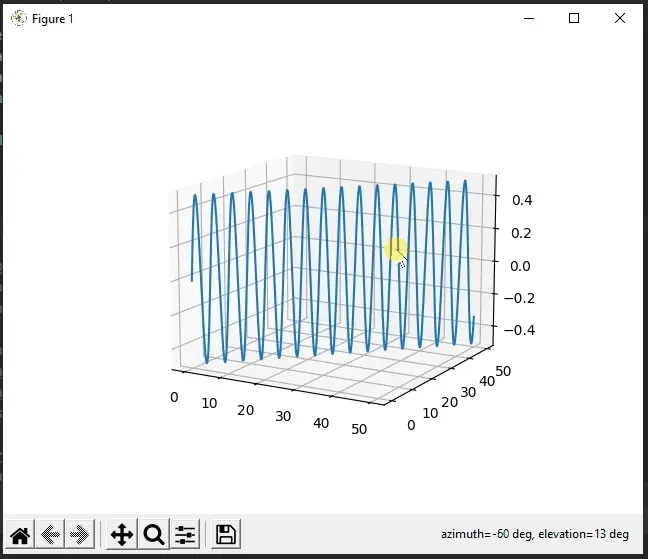
axes.plot(x_data, y_data, z_data)
plot.show()
Output:
Create a Multiple Colors 3D Line Plot in Matplotlib
This example demonstrates how to use multiple colors 3D line plots. In the following code, we are just separating every line segment and iterating a loop over six predefined colors.
colors = "rgbcmy"
for i in range(len(x_data) - 1):
    axes.plot(
        x_data[i : i + 2], y_data[i : i + 2], z_data[i : i + 2], color=colors[i % 6]
    )
    # ax.plot(x[i:i+2], y[i:i+2], z[i:i+2], color=cols[i%6])
Full Code Example:
import numpy as np
import matplotlib.pyplot as plot
from mpl_toolkits import mplot3d

axes = plot.axes(projection="3d")
x_data = np.arange(0, 50, 0.1)
y_data = np.arange(0, 50, 0.1)
z_data = np.sin(x_data) * np.cos(y_data)

colors = "rgbcmy"
for i in range(len(x_data) - 1):
    axes.plot(
        x_data[i : i + 2], y_data[i : i + 2], z_data[i : i + 2], color=colors[i % 6]
    )
    # ax.plot(x[i:i+2], y[i:i+2], z[i:i+2], color=cols[i%6])

plot.show()
Output:

Click here to read detailed documentation about 3D plots.

Hello! I am Salman Bin Mehmood(Baum), a software developer and I help organizations, address complex problems. My expertise lies within back-end, data science and machine learning. I am a lifelong learner, currently working on metaverse, and enrolled in a course building an AI application with python. I love solving problems and developing bug-free software for people. I write content related to python and hot Technologies.
LinkedIn